
ELCARO algorithms, right on your chart
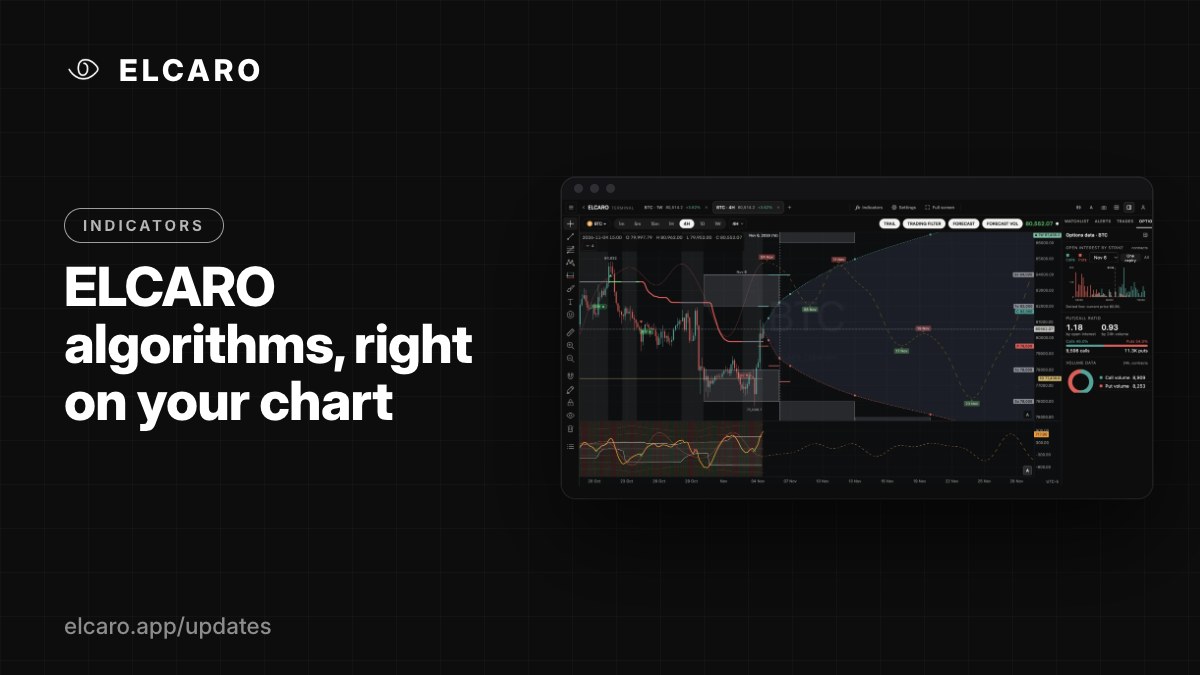
Forecast, Forecast VOL, TRAIL, the trading filter and divergences, drawn on the candles you are reading. Here is the map of what each one does.
What it gives you
In the app you read the forecast and the price on separate screens. In the Terminal they sit together: ELCARO's own indicators are drawn on the same chart as the candles, on the timeframe you are looking at.
The ELCARO set
- Forecast: the expected path of the price with its turning dates. Peaks start a decline phase, troughs start a growth phase.
- Forecast VOL: the same kind of forecast for the trading filter line.
- TRAIL: a stepped level that follows the trend and changes colour with the phase.
- Higher-timeframe trail levels: the TRAIL of 1H, 4H, 1D and 1W drawn as step lines on a lower-timeframe chart.
- Trading filter: an oscillator pane under the chart with bands, a centre line and sigma levels.
- Divergences: regular and hidden divergences between price and the filter, marked in the pane and on the chart.
How to switch them on
Click Indicators (the fx button) in the header. The ELCARO section is at the top: each row has a switch and Settings. On a single chart you can also click the chips in the chart header: TRAIL · TRADING FILTER · FORECAST · FORECAST VOL.
Good to know
The calculation inputs are fixed by the ELCARO engine, so everyone sees the same lines. In Settings you change only how they look: opacity, markers, dates and backgrounds. A fresh workspace opens with all four switched on. Each of them gets its own post in the coming days.