
Updates · Product
What's new.
Every feature we ship across web, Telegram and the mobile apps, with what it gives you and how to use it. The algorithm forecasts; the AI assistant explains.
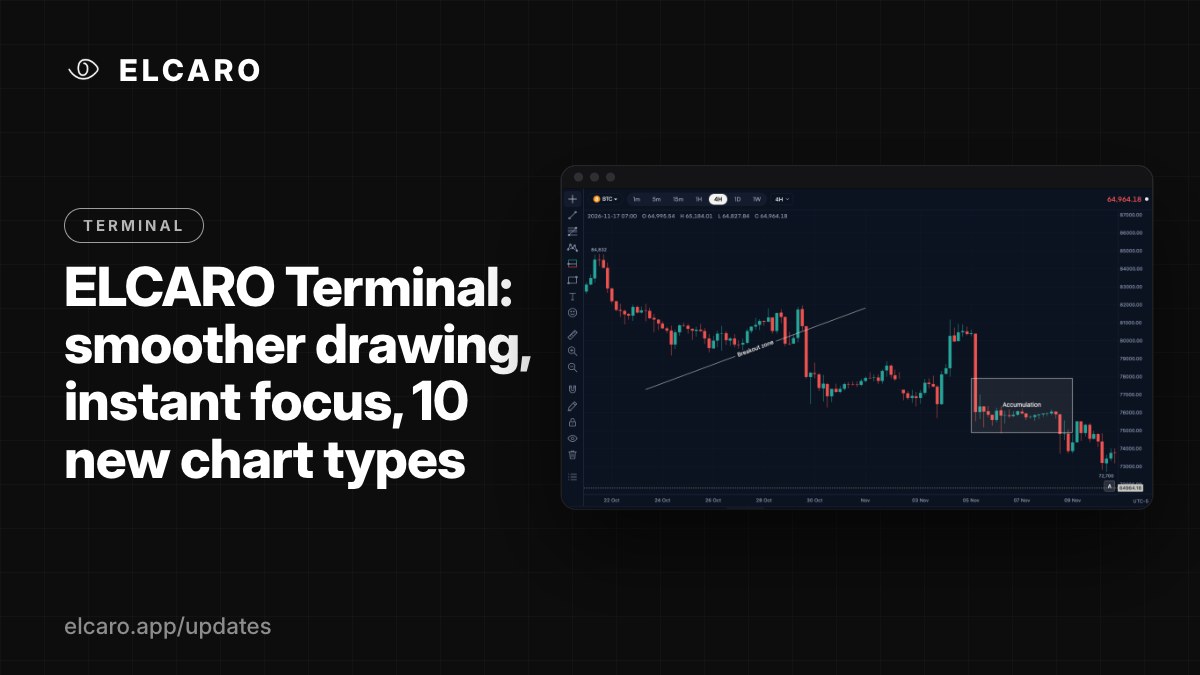
ELCARO Terminal: smoother drawing, instant focus, 10 new chart types
ELCARO Terminal gets smoother drawing tools, one-gesture pane focus, 10 new chart types and themes with an accent colour of your choice.
Read more
Forecast VOL: where the trading filter is heading
A forecast of the trading filter line itself, with its own turn dates.
Read more
TRAIL: the phase you are in, and where it would break
A stepped level that follows the trend and marks the bar where it flips.
Read more
Higher-timeframe TRAIL levels on one chart
The 1H, 4H, 1D and 1W trail levels on the chart you are on.
Read more
The trading filter: how far price has stretched
The oscillator under every ELCARO chart: phases, bands and how stretched the move is.
Read more
Sigma levels: is this stretch normal, or rare?
σ1, σ2 and σ3 on the trading filter: how unusual the current stretch is.
Read more
Divergences: when price and the filter stop agreeing
Price and the filter disagreeing, marked when they appear and when they activate.
Read more
Growth start, decline start, with the dates
The dates the next growth and decline phases are expected to start.
Read more
Timeframe alignment: one message when the frames agree
A message when the timeframes you pick for an asset point to the same phase.
Read more
BTC volatility: not which way, but how far
Not which way BTC moves, but how wide its swings are expected to be.
Read more
The AI agent: the forecast, explained in words
One written read of an asset across every timeframe, and answers to your questions.
Read more
Alerts: a message when it matters, silence when it does not
Telegram messages on forecast turns, divergences, TRAIL flips and your own lines.
Read more
The ELCARO phase of every asset, at a glance
The ELCARO phase, next turn and 4H, 1D, 1W phases without opening a chart.
Read more
Δ0.1 levels: where price is unlikely to go
Where the options market gives price only about a 10% chance of reaching by each expiry.
Read more
Options σ ranges: the range the market expects by expiry
The 1σ and 2σ range by each expiry, built from the at-the-money straddle.
Read more
Expected Move: how far the market expects price to move
A cone of the 1σ move the options market implies at every listed expiry.
Read more
Options data: open interest, put/call and IV in one panel
Open interest by strike, put/call ratio, implied volatility and recent options trades.
Read more
PRIME: three timeframes, one status
The 4H chart read against the daily and weekly phases, summed up in one status.
Read more
The Terminal help section is live
56 articles on the ELCARO Terminal, from your first ten minutes to every indicator and drawing tool. Here is the map.
Read more
28 indicators, one manual each
The Standard indicators article lists all 28 classic indicators, how to add and set them up, and how many fit on one chart.
Read more
MA: the plain moving average
The average of the last closes as one line on the price chart, with every bar weighted the same.
Read more
EMA: recent bars weigh more
An average of the close that leans on the latest bars, so it turns sooner than a plain MA of the same length.
Read more
SMA: the smoothed moving average
In the Terminal, SMA is the smoothed average SMA(N, M): a slow line that mixes each close with its previous value.
Read more
WMA: the newest bar weighs most
A moving average whose weights fall in a straight line from the newest bar to the oldest. Quicker than MA, with a hard cut-off.
Read more
Bollinger Bands: volatility around the average
A middle average with two bands that move apart when prices swing more and come together when the market calms down.
Read more
Drawing tools in one post
What the drawing toolbar holds, the buttons that keep a chart tidy, and the eleven help articles that cover every tool.
Read more
Parabolic SAR: dots that flip sides
One dot per bar: below price in a rising run, above it in a falling run. The dots flip when price crosses them.
Read more
BBI: four averages in one line
The Bull and Bear Index blends four moving averages of the close, quick and slow, into a single line on the price chart.
Read more
AVP: the volume-weighted average price
The average price of the loaded history, weighted by volume, drawn as one line on the price chart.
Read more
Volume: how much changed hands
Volume bars in their own pane, coloured by each candle's direction, with three moving averages of volume on top.
Read more
MACD: the gap between two averages
MACD tracks the gap between a quick and a slow exponential average of the close, with a histogram of how that gap changes.
Read more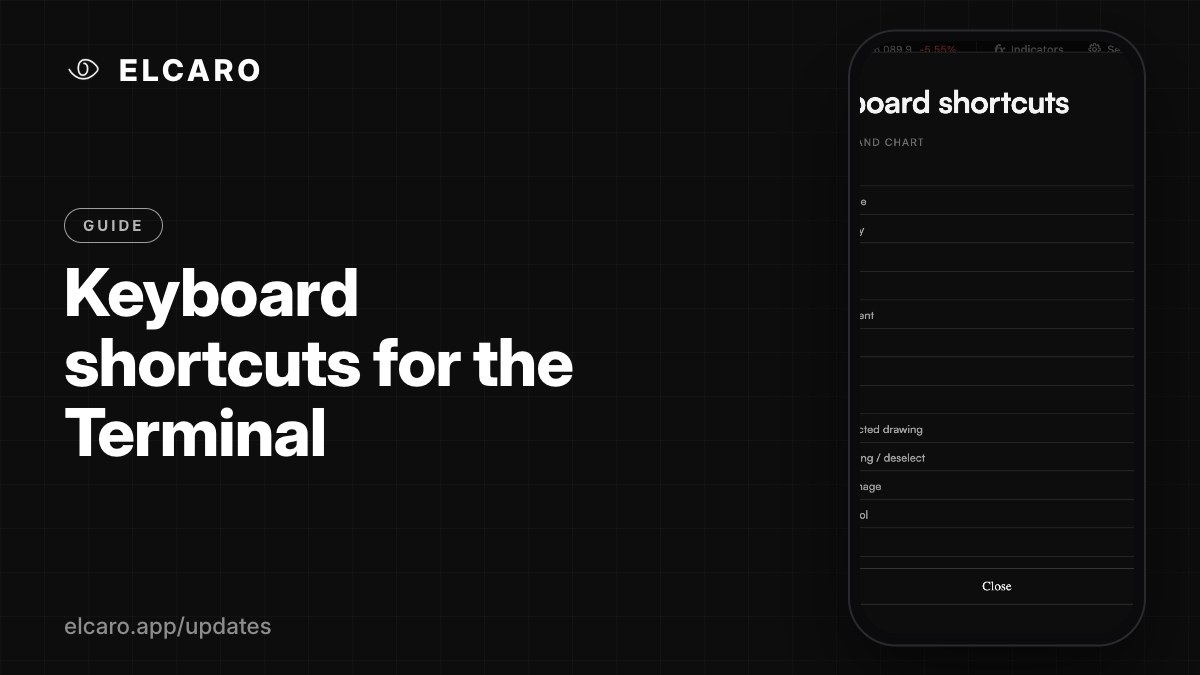
Keyboard shortcuts for the Terminal
Six drawing hotkeys, undo and redo, alerts, snapshots and symbol search. Press ? on the chart to see the full list.
Read more
KDJ: where the close sits
A stochastic oscillator with K, D and an extra J line: where the close sits in the recent high-low range.
Read more
RSI: momentum from 0 to 100
RSI weighs the rises of the close against the falls over 14 bars, on a scale from 0 to 100 with 50 as the balance point.
Read more
Williams %R: the close in range
Where the latest close sits in the high-low range of the last 14 bars, on a scale from -100 to 0, with no smoothing.
Read more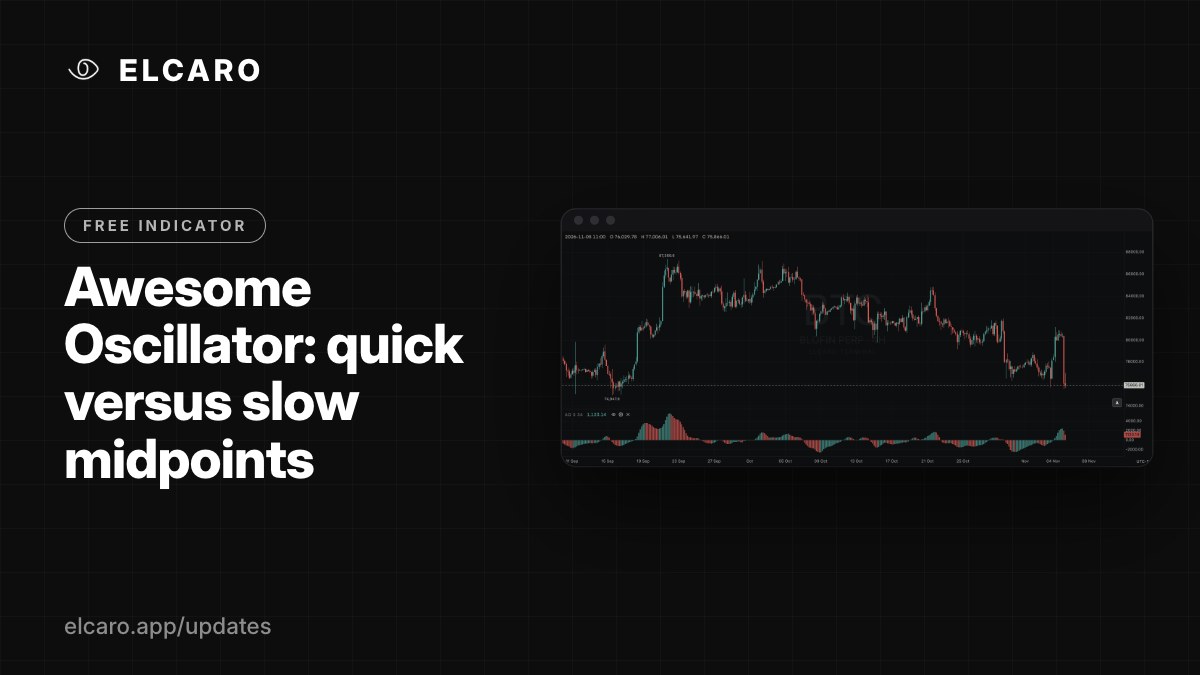
Awesome Oscillator: quick versus slow midpoints
Bars around zero for the gap between a quick and a slow average of bar midpoints, coloured by whether the gap grew.
Read more
Momentum: the speed of a move
The close minus the close 12 bars ago, in price units, with its own moving average. The simplest measure of speed.
Read more
The ELCARO indicators, explained in Help
Six help articles cover ELCARO's own indicators in the Terminal: Forecast, Forecast VOL, TRAIL, the trading filter, divergences and phase.
Read more
DMI: direction and trend strength
+DI and -DI split movement into up and down, while ADX and ADXR show how strong the trend is, whatever its direction.
Read more
CCI: how far price strays
How far a bar's typical price sits from its recent average, in units of how far it usually strays. Most readings stay within ±100.
Read more
TRIX: a triple-smoothed rate of change
The percent change of a close smoothed three times. Small swings are filtered out, so TRIX moves only with the larger movement.
Read more
ROC: momentum in percent
The percent change of the close against the close 12 bars ago. It is Momentum in percent, so readings compare across assets.
Read more
BIAS: distance from the average
How far the close sits from its moving average, in percent, for a quick, a medium and a slow period at once.
Read more
Options levels and order flow
Three help articles cover what the options market implies on your chart, the options data panel and order flow.
Read more
PSY: the share of rising bars
The share of the last 12 bars that closed higher than the bar before, in percent. It counts bars and ignores their size.
Read more
BRAR: two ratios of push
Two ratios comparing how far bars reach above and below the open and the previous close, around a balance line at 100.
Read more
OBV: a running total of volume
Volume added on bars that close higher and taken away on bars that close lower. Its direction matters more than its level.
Read more
VR: rising versus falling volume
The volume of rising bars against the volume of falling bars over the period, around a balance line at 100.
Read more
PVT: volume weighted by price change
A running total that adds each bar's volume in proportion to its percent change in price. A calmer cousin of OBV.
Read more
Workspace and alerts, in Help
Three help articles on layouts and tabs, timeframes and chart types, and alerts that keep working while you are away.
Read more
EMV: how easily price moves
Ease of Movement shows how far a bar's midpoint moved for its range and volume. Big moves on thin volume read high.
Read more
CR: the Energy Index
How far highs and lows reach from the previous bar's middle price, as one ratio with four moving averages.
Read more
DMA: the gap between averages
The gap between a quick and a slow simple average of the close, with AMA as the average of that gap. Like MACD, but simpler.
Read more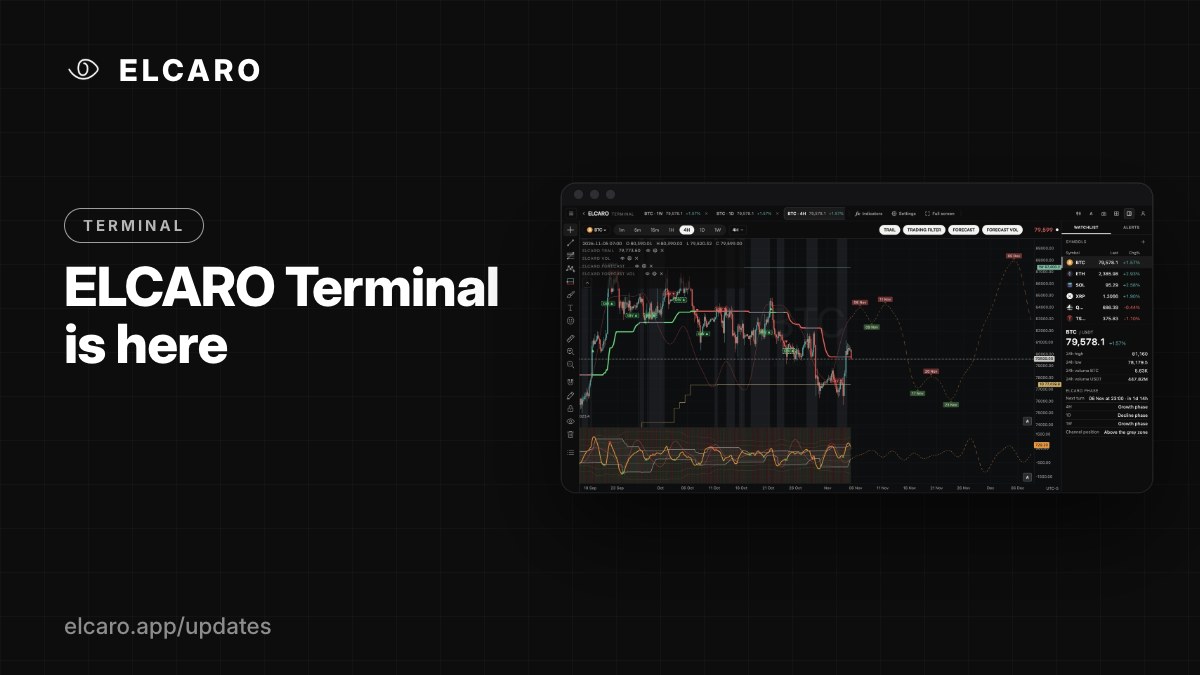
ELCARO Terminal is here
A full-screen chart workspace with ELCARO's own indicators on the candles, every asset and every timeframe. Open to every account.
Read more
Your plan already includes the Terminal
Starter, Basic, Pro and Platinum open the ELCARO indicators in the Terminal on your plan's assets and timeframes. Nothing to switch on.
Read more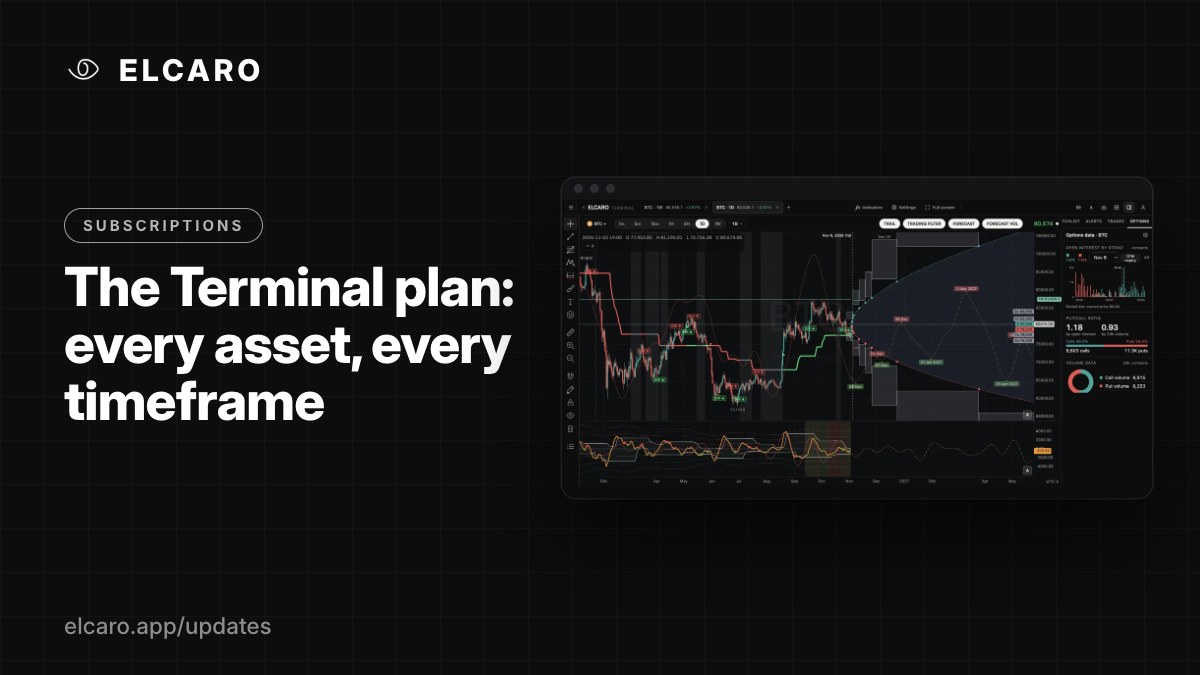
The Terminal plan: every asset, every timeframe
One plan that opens every ELCARO indicator on every asset and every timeframe, from one minute to one week and your own custom intervals.
Read more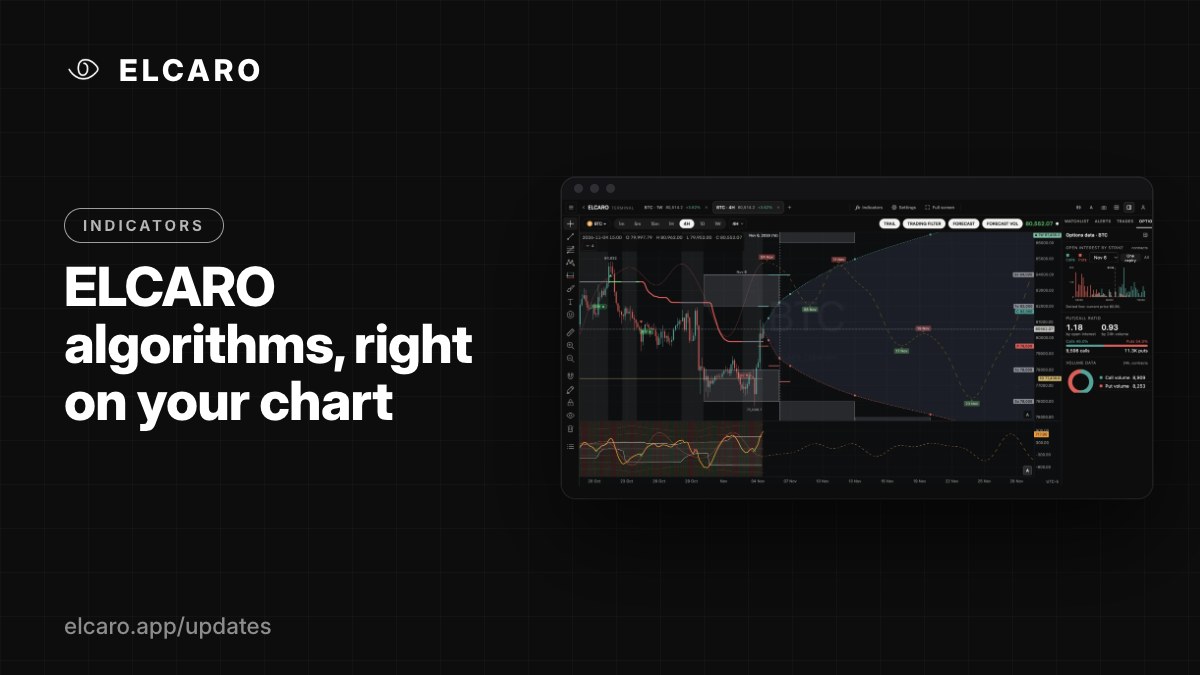
ELCARO algorithms, right on your chart
Forecast, Forecast VOL, TRAIL, the trading filter and divergences, drawn on the candles you are reading. Here is the map of what each one does.
Read more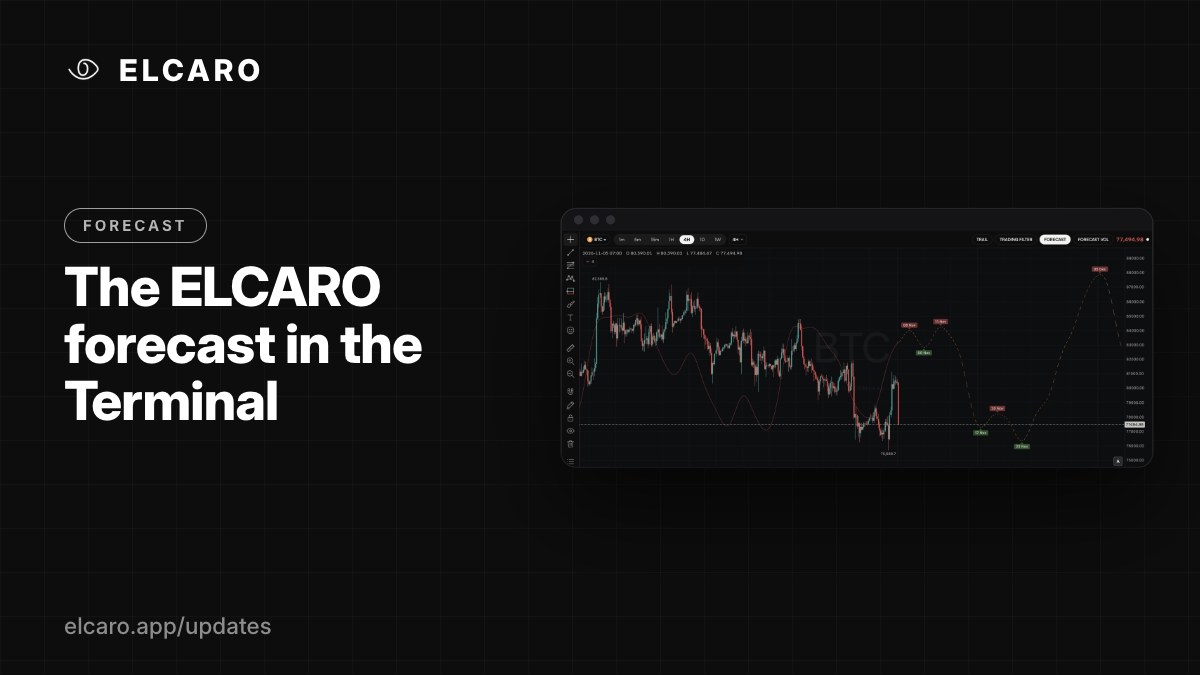
The ELCARO forecast in the Terminal
The expected path of the price, drawn over the candles: a solid fitted part, a dashed part ahead, and the turns that start each phase.
Read more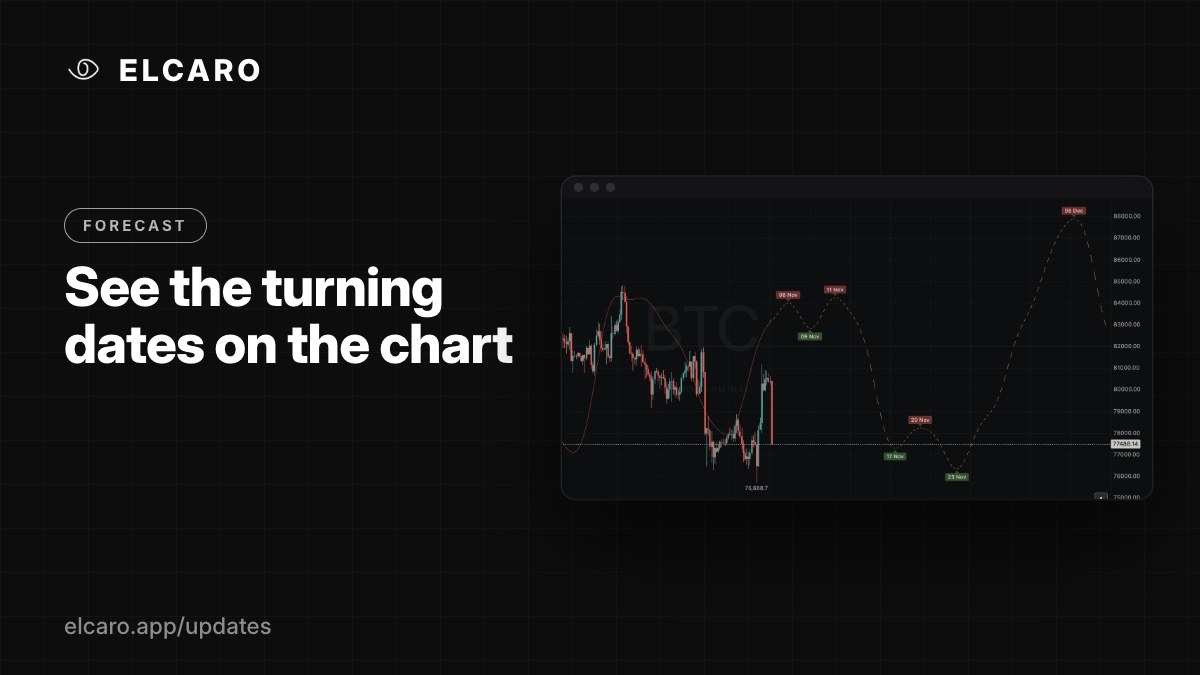
See the turning dates on the chart
Switch on turn dates and every expected peak and trough of the forecast gets a date chip. Hover for the exact time.
Read more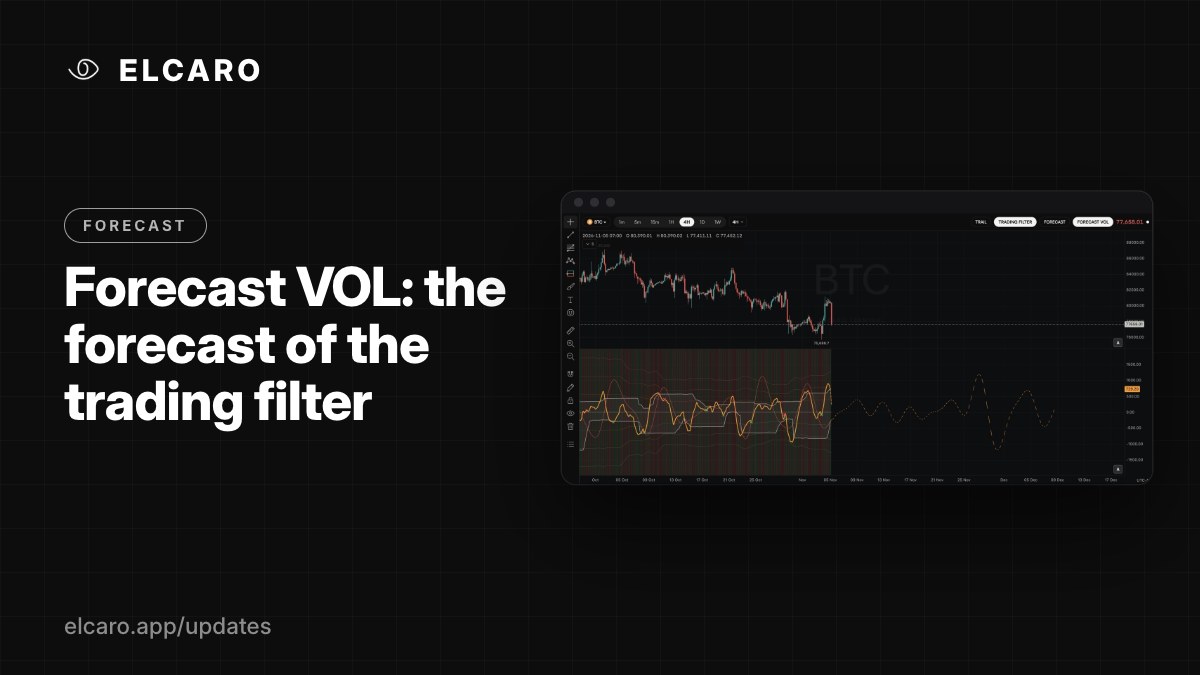
Forecast VOL: the forecast of the trading filter
A forecast curve for the trading filter line, with its own turning dates. Keep it in the filter pane or draw it over the price.
Read more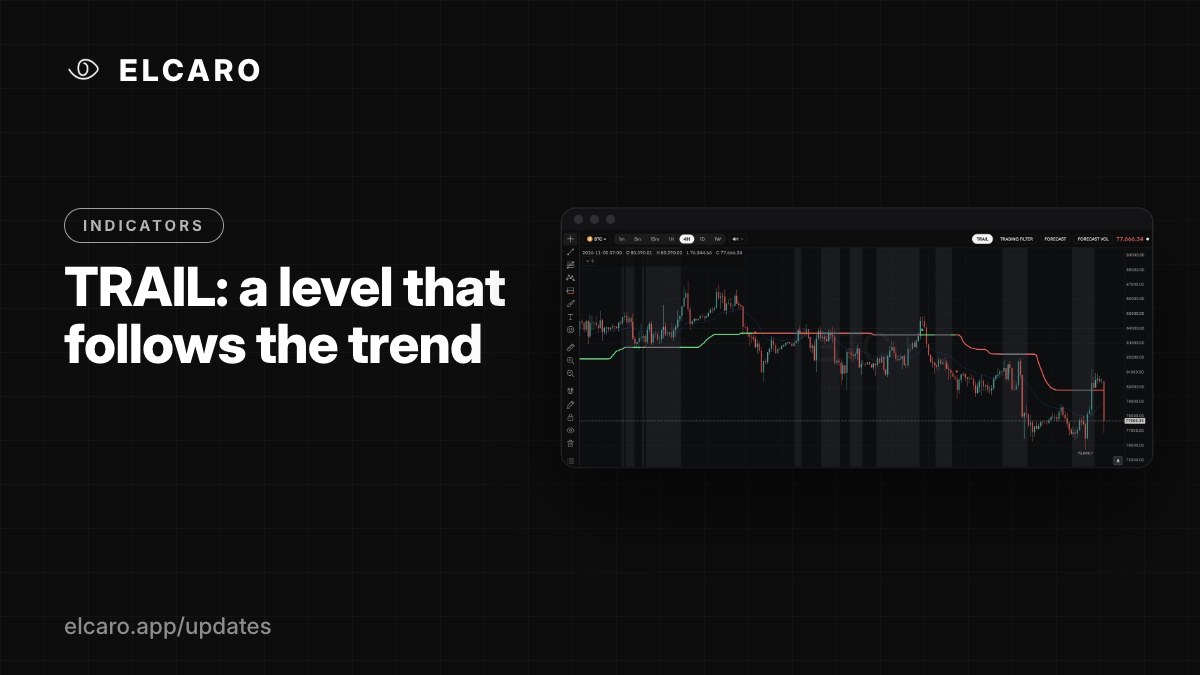
TRAIL: a level that follows the trend
A stepped line on the price chart that changes colour with the phase, flips when the trend turns and marks the grey zone.
Read more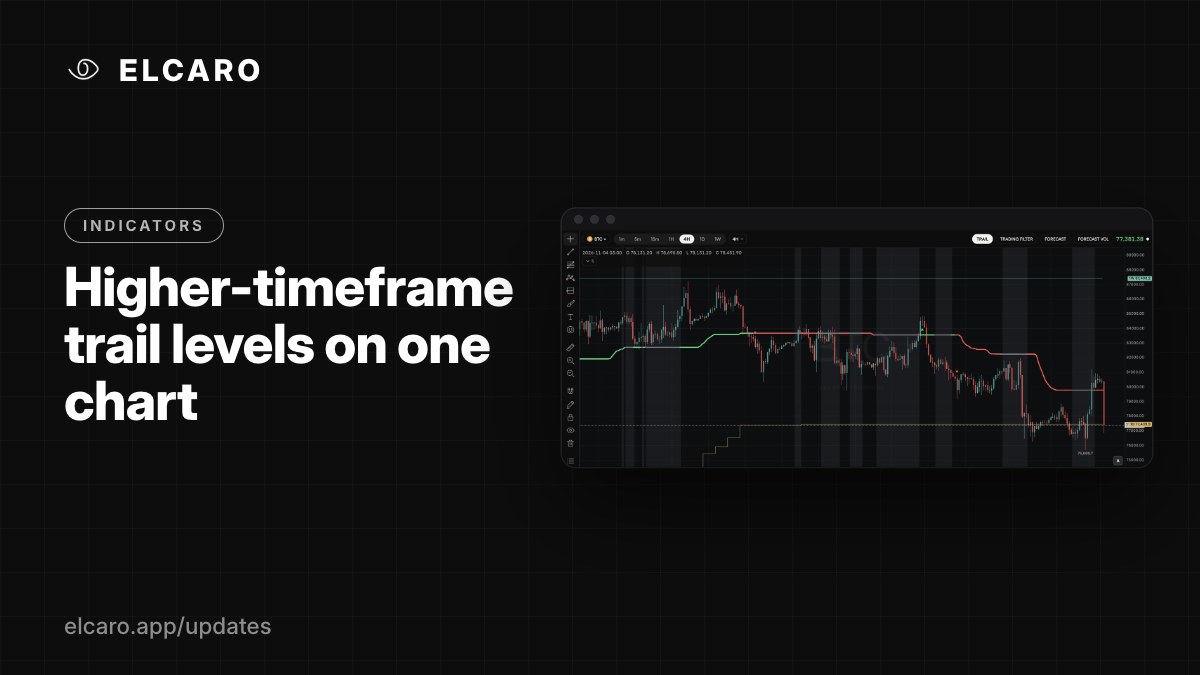
Higher-timeframe trail levels on one chart
See the TRAIL of 1H, 4H, 1D and 1W as step lines on a lower-timeframe chart, without switching charts.
Read more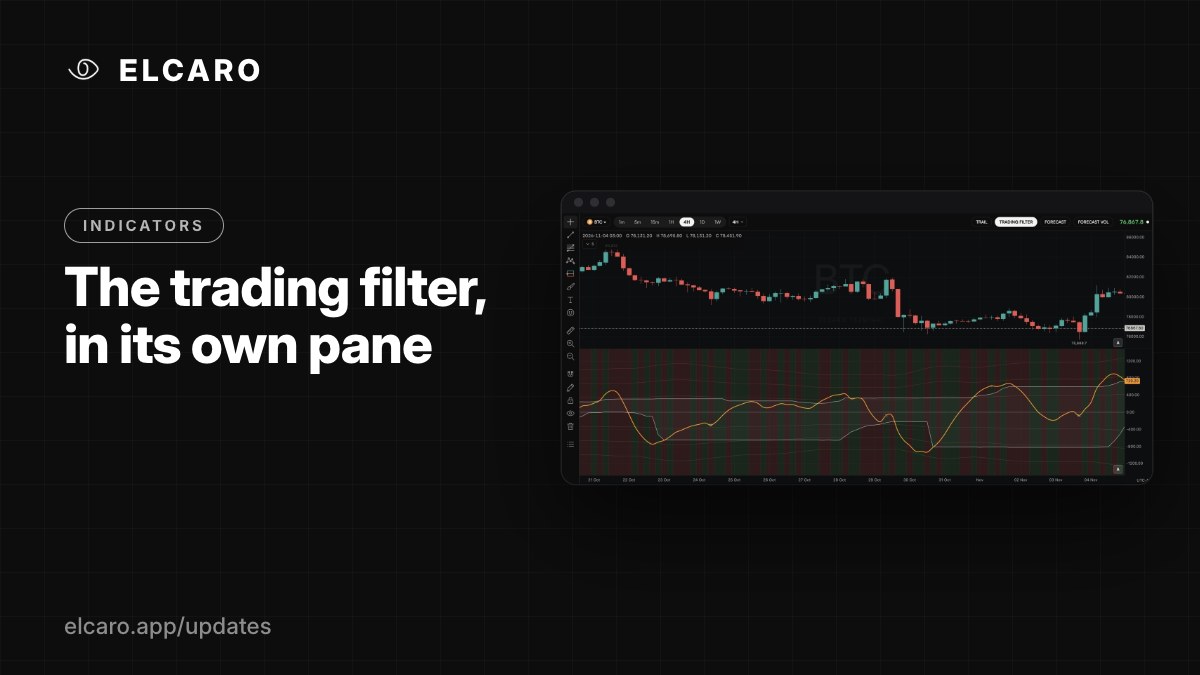
The trading filter, in its own pane
The VOL oscillator with its bands, centre line, sigma levels and phase highlight, under every chart you open.
Read more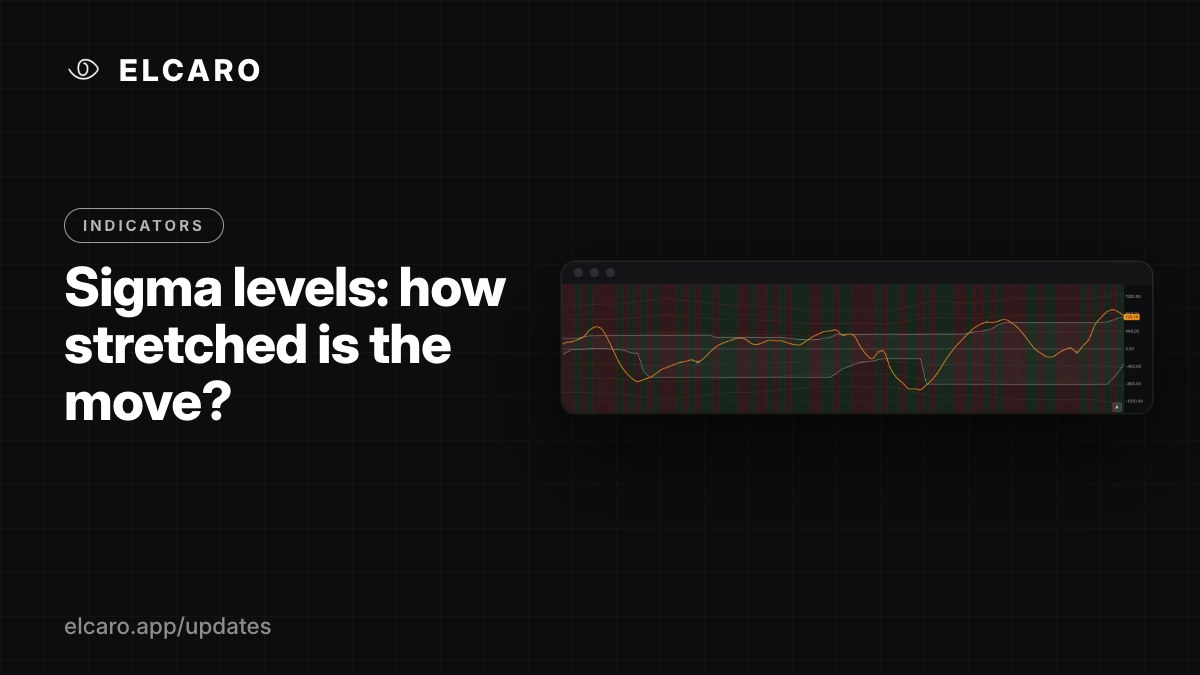
Sigma levels: how stretched is the move?
The ±1σ, ±2σ and ±3σ lines on the trading filter show how unusual the current reading is. Here is how to read them.
Read more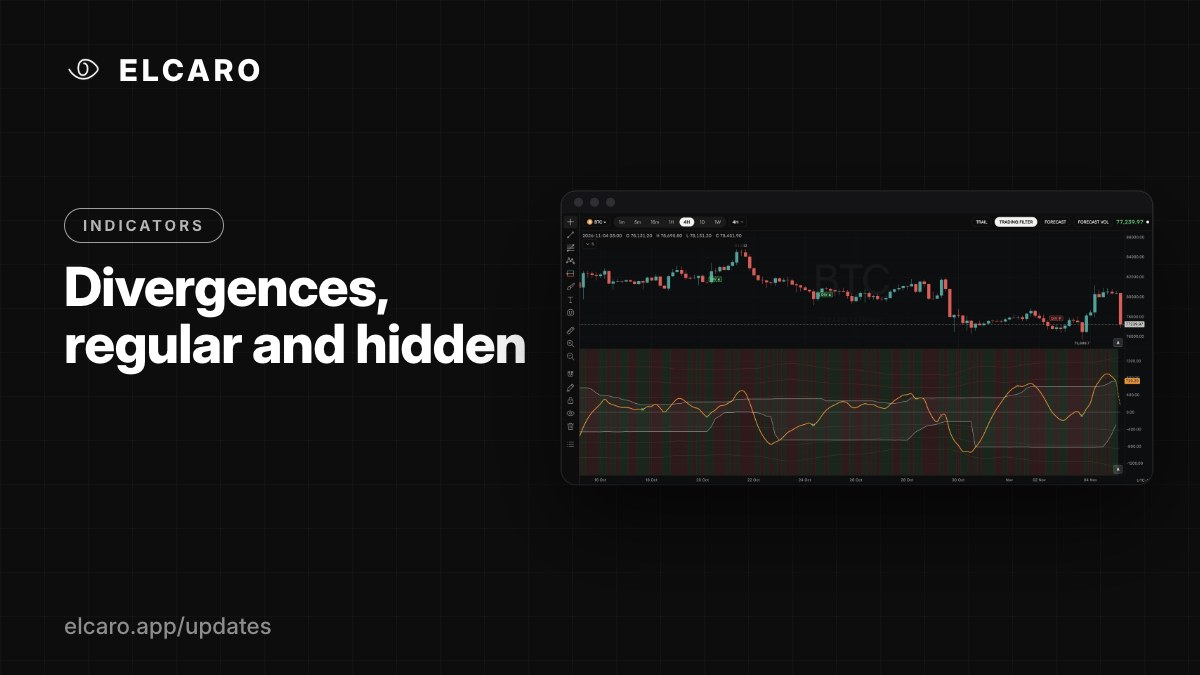
Divergences, regular and hidden
Where price and the trading filter disagree. Crosses and triangles in the filter pane, DIV chips on the price chart, and two stages to follow.
Read more
Alerts on ELCARO events
Get a Telegram message when a forecast turn is near, a divergence appears, TRAIL flips or the trading filter crosses a line.
Read more
Alerts that keep working while you're away
Repeat, cooldown, expiry and your own message text. Delivered to Telegram and the app from our servers, with the Terminal closed.
Read more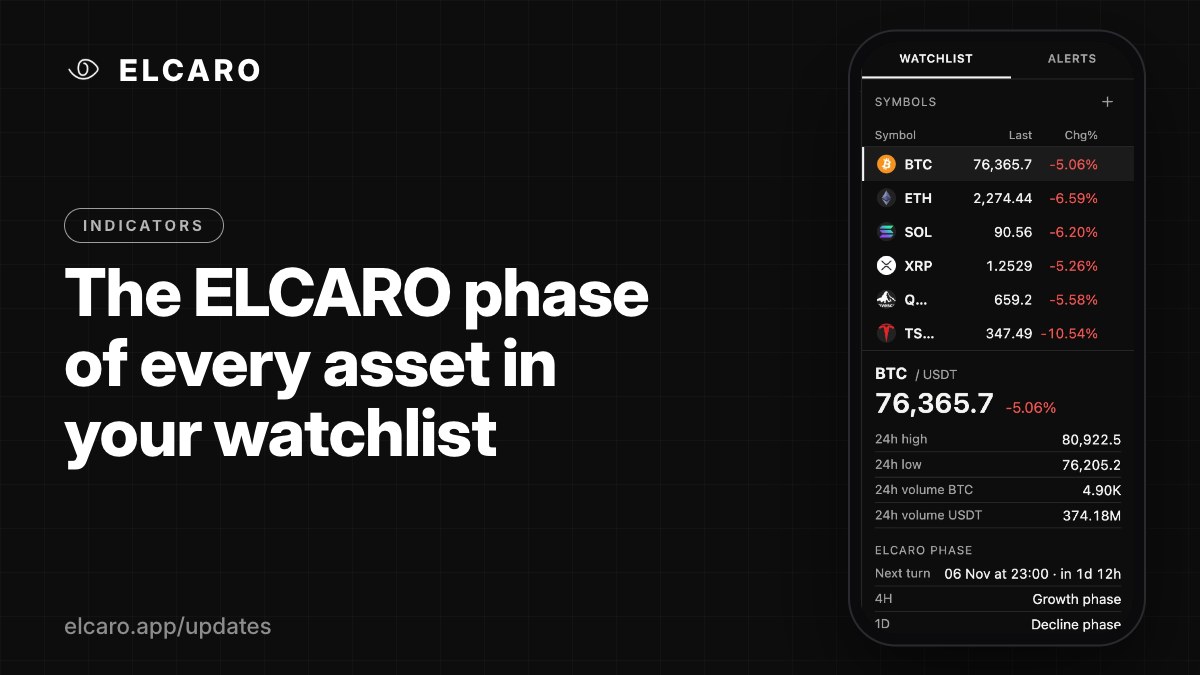
The ELCARO phase of every asset in your watchlist
Open an asset in the watchlist to see its phase on 4H, 1D and 1W, the date of the next turn with a countdown, and its channel position.
Read more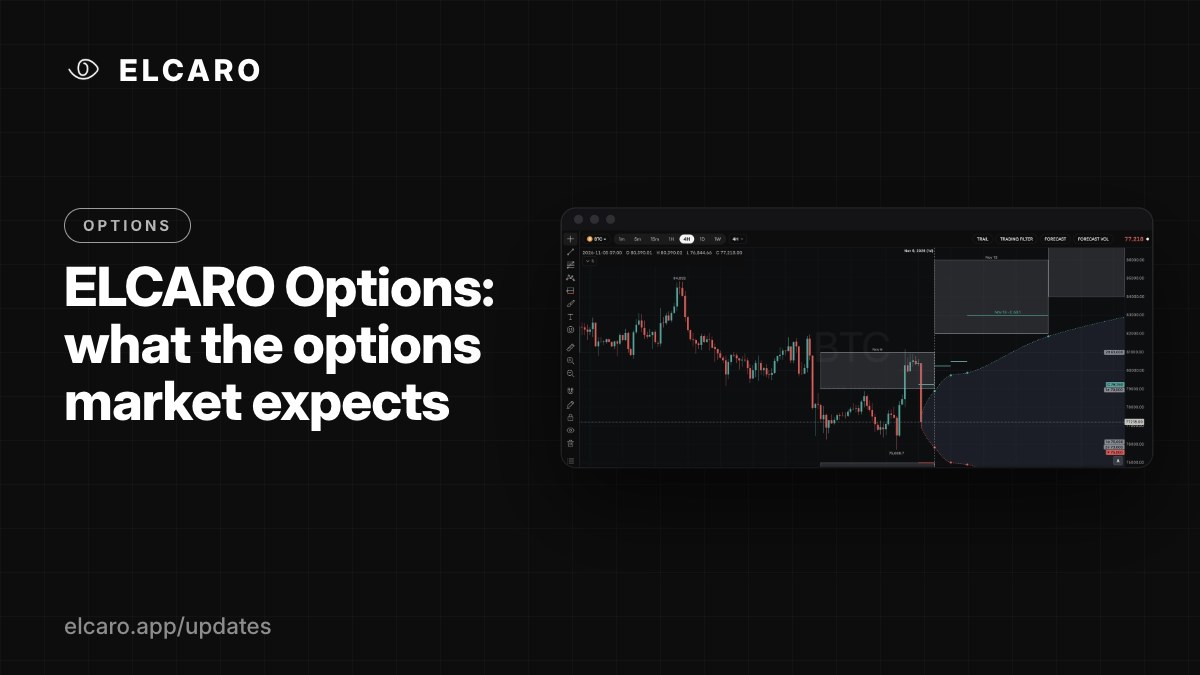
ELCARO Options: what the options market expects
Four tools that turn live options prices into levels on your chart: Δ0.1 levels, straddle σ boxes, the Expected Move cone and an options data panel.
Read more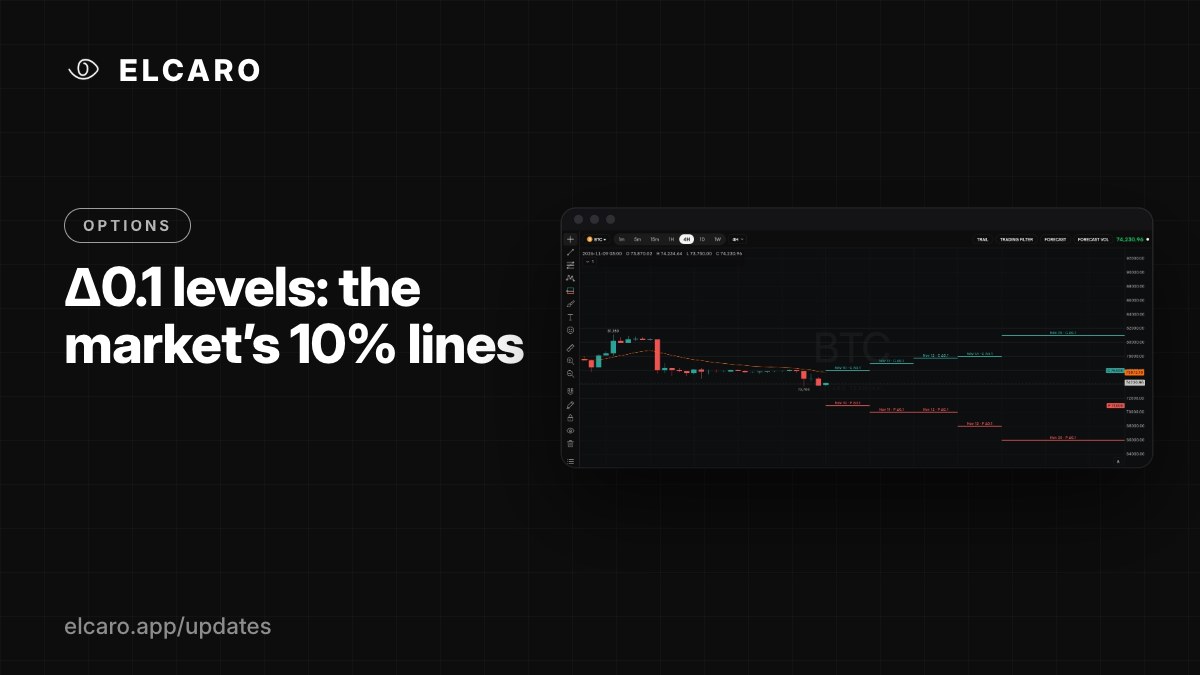
Δ0.1 levels: the market's 10% lines
Two lines per expiry: above, where calls price about a 10% chance of reaching; below, the same for puts. They move live.
Read more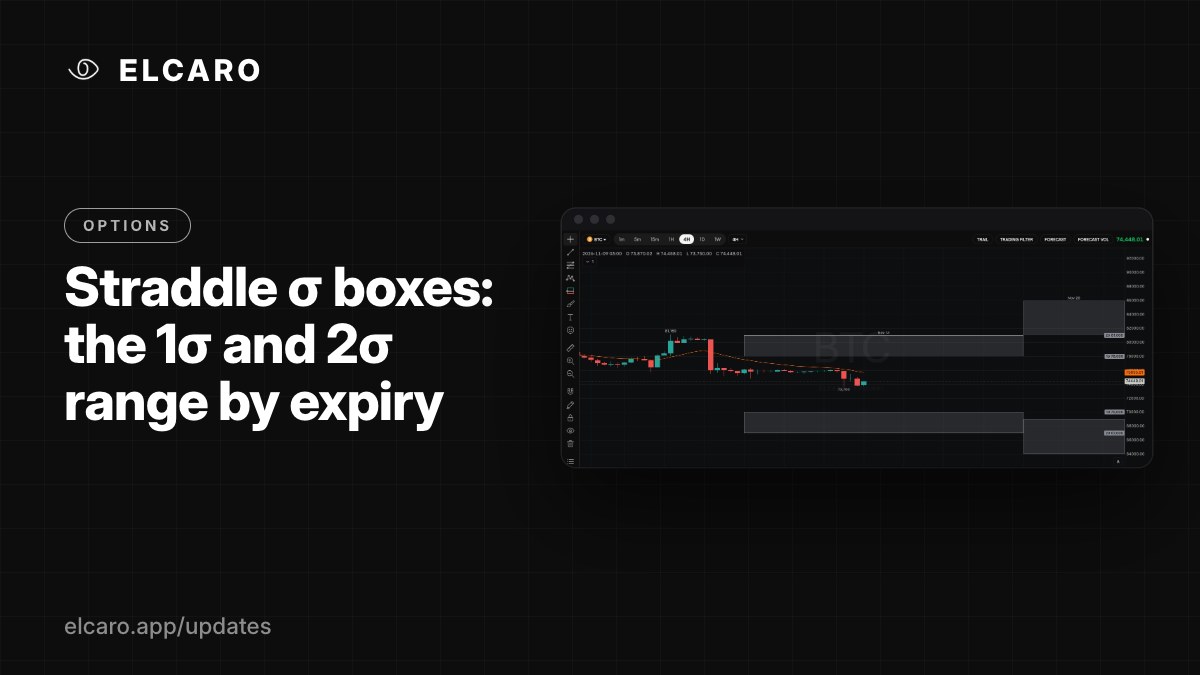
Straddle σ boxes: the 1σ and 2σ range by expiry
Grey boxes between 1σ and 2σ above and below the price, built from the at-the-money straddle for each expiry.
Read more
Expected Move: a cone to every expiry
A cone to the right of the last candle showing the 1σ range the options market implies at every listed expiry date.
Read more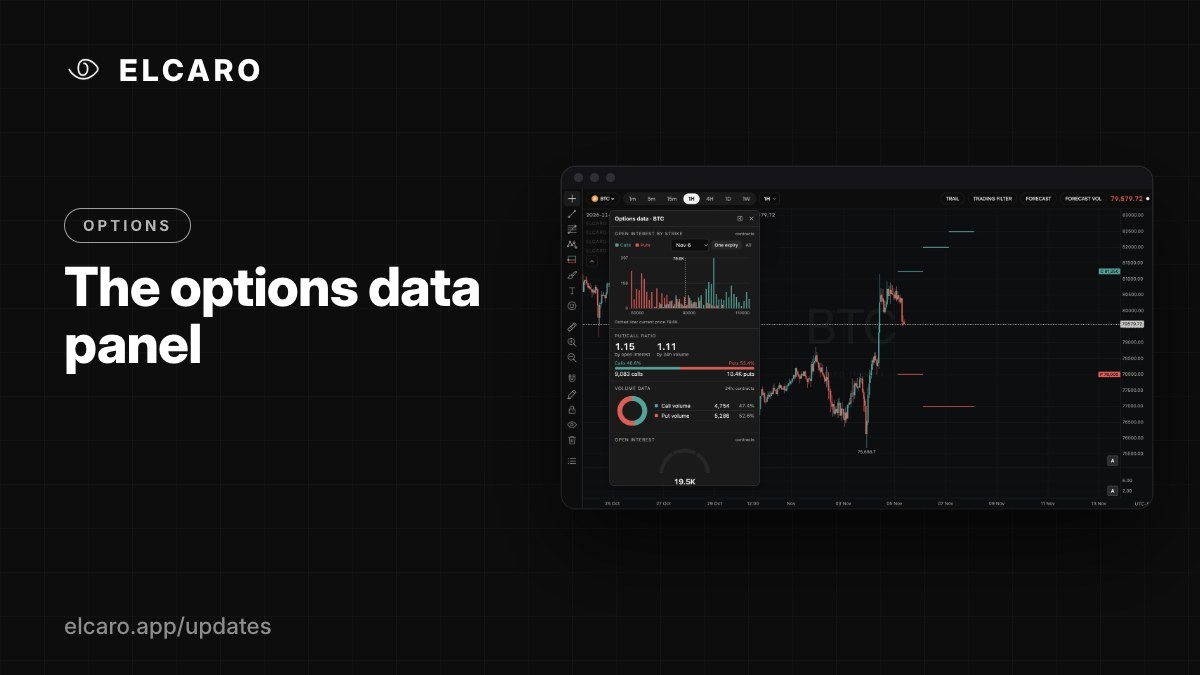
The options data panel
Options volume, open interest by strike, put/call ratio, implied volatility and recent trades for the asset on your chart, in one panel.
Read more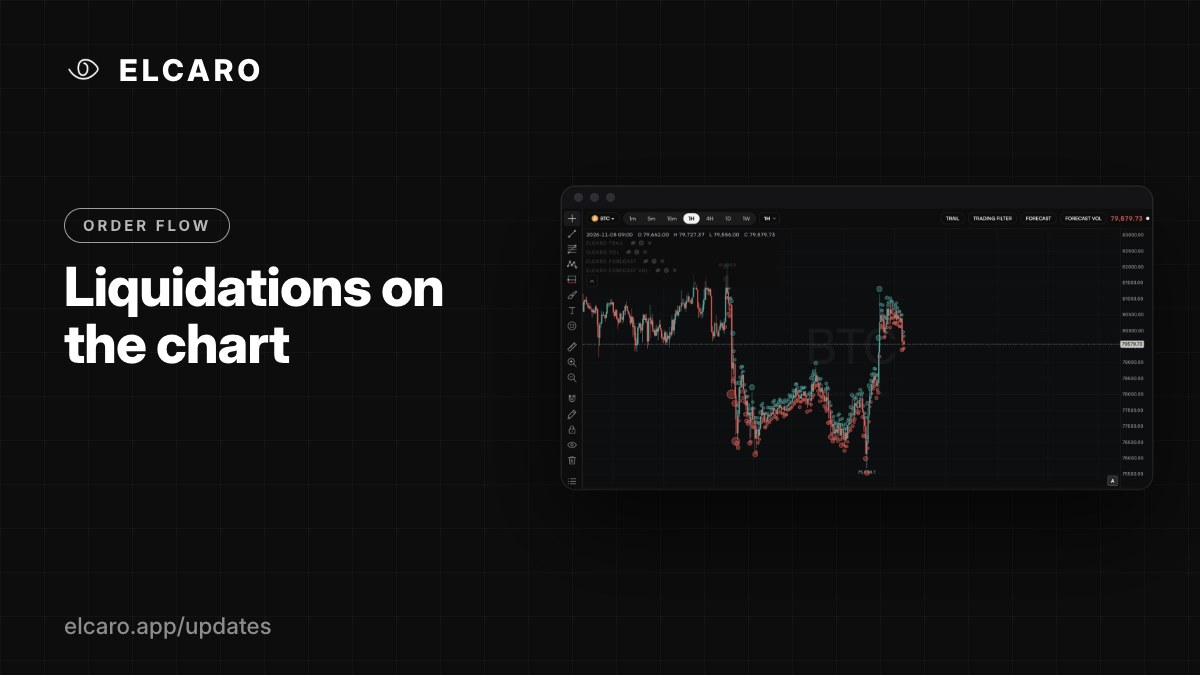
Liquidations on the chart
A bubble per bar sized by the amount liquidated, with forced short closes above the bar and forced long closes below, plus a summary.
Read more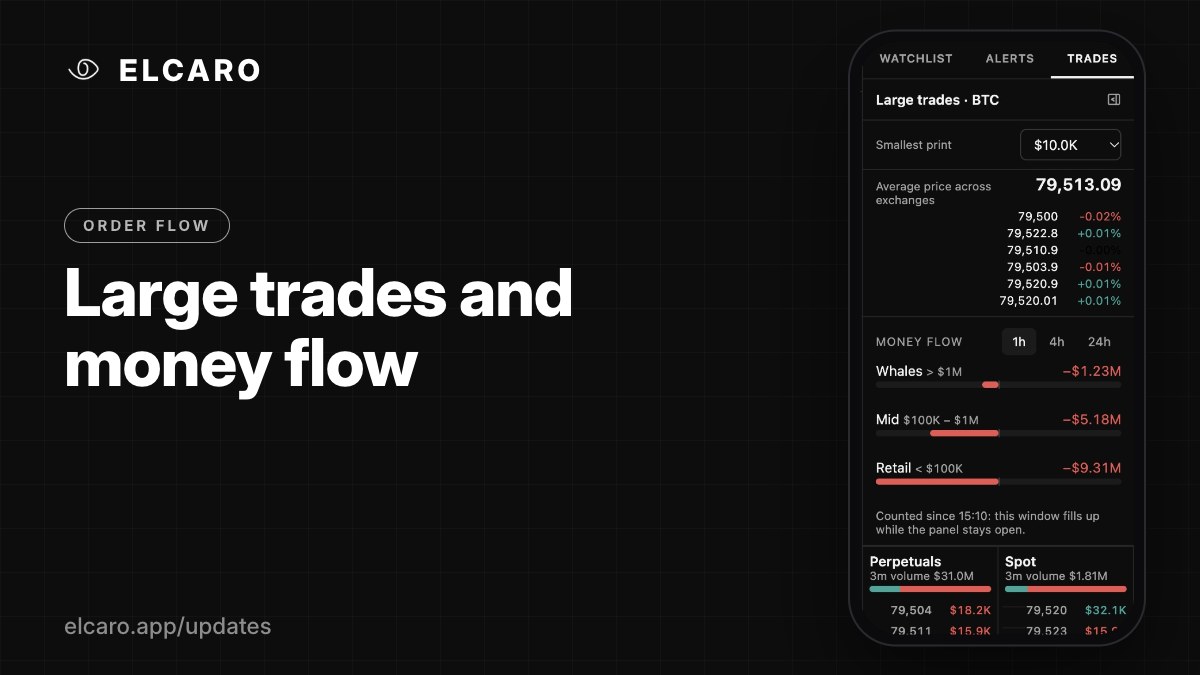
Large trades and money flow
A live panel with large perpetual and spot trades across exchanges, the average price, and net flow by whales, mid-size and retail.
Read more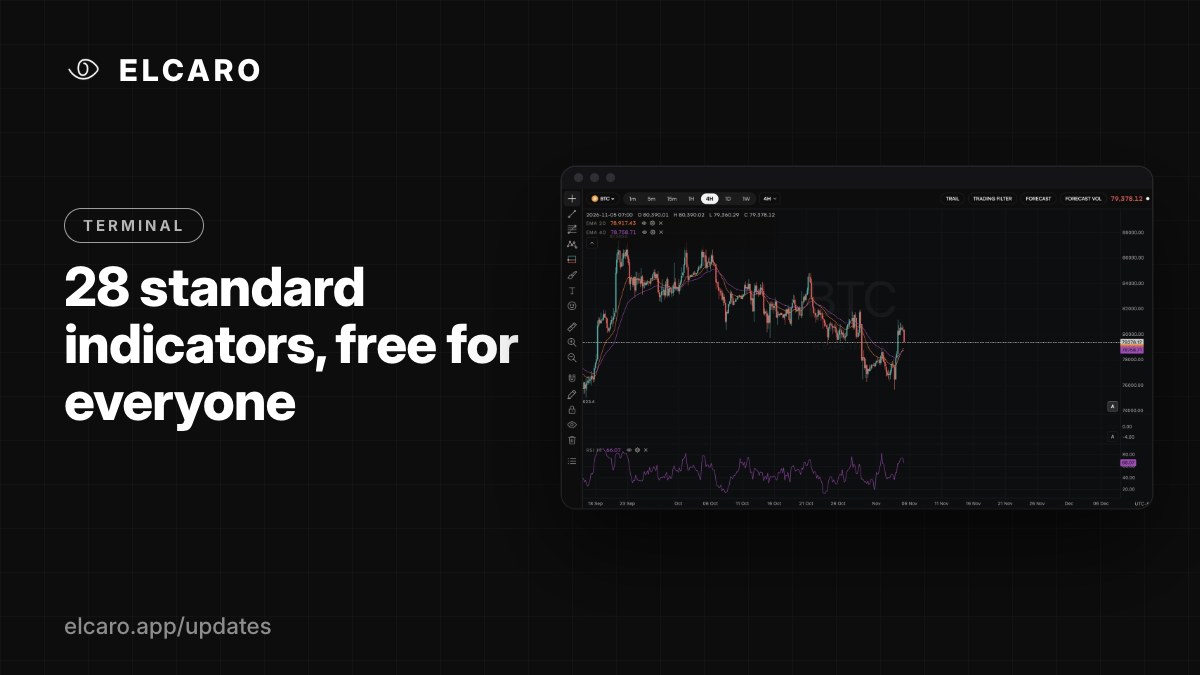
28 standard indicators, free for everyone
Moving averages, Bollinger Bands, RSI, MACD, volume and more. Every account can use them, with full settings.
Read more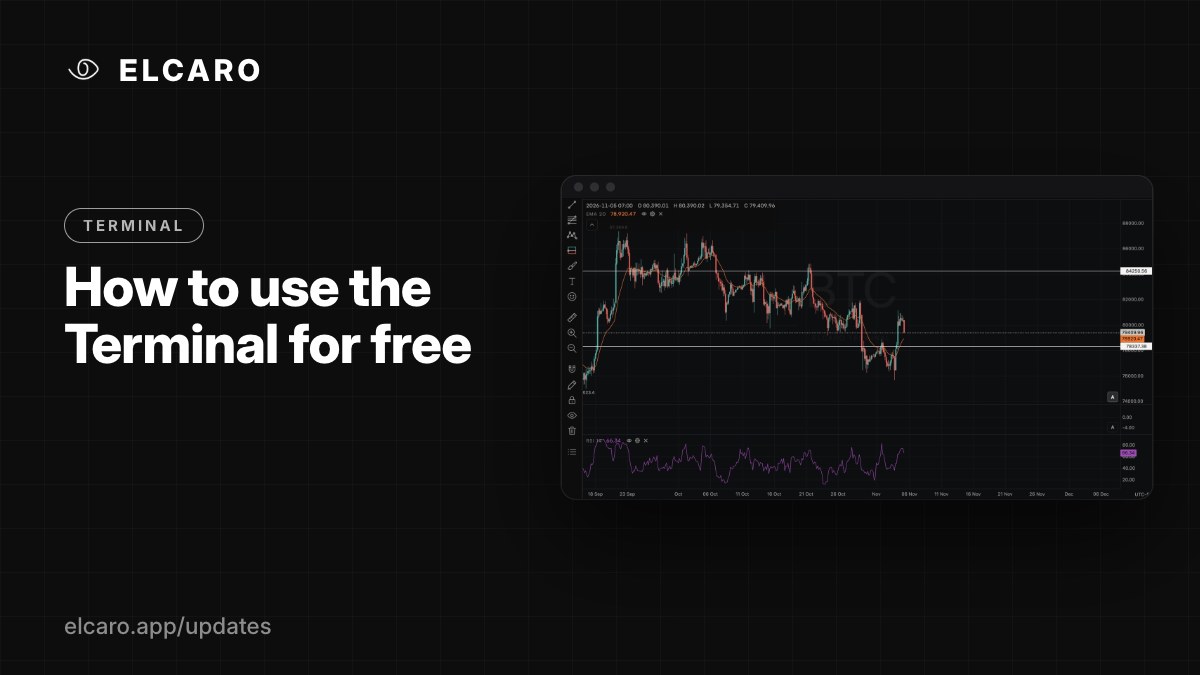
How to use the Terminal for free
No plan needed: every asset, every timeframe, all chart types, 80+ drawing tools, price alerts and two standard indicators.
Read more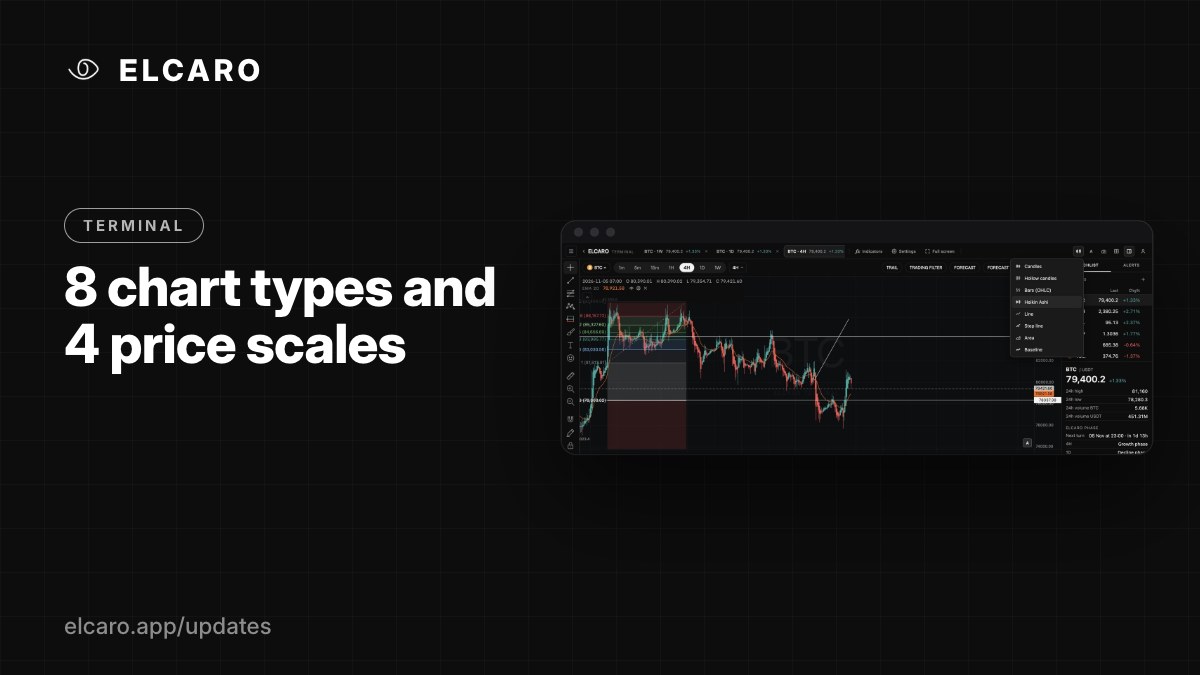
18 chart types and 4 price scales
Candles, Heikin Ashi, line, area and more, with regular, percent, indexed and logarithmic scales. Free for every account.
Read more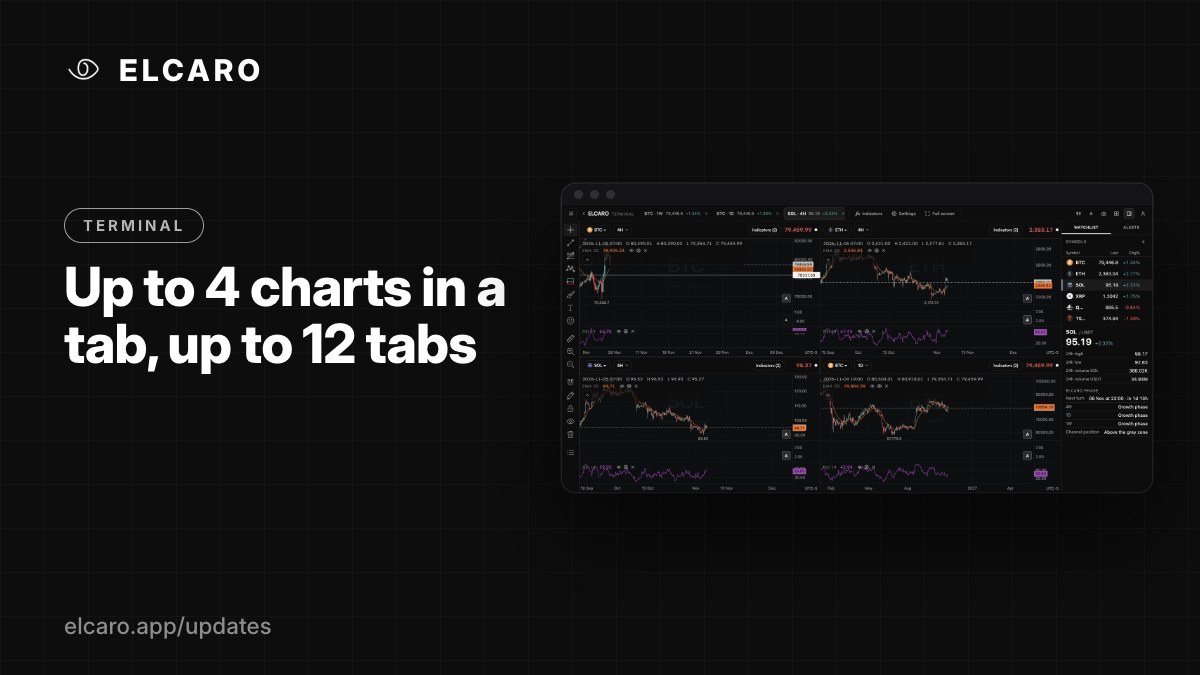
Up to 4 charts in a tab, up to 12 tabs
Ten layouts, synced symbol, timeframe and crosshair, and up to 12 tabs, each with its own setup. Free for every account.
Read more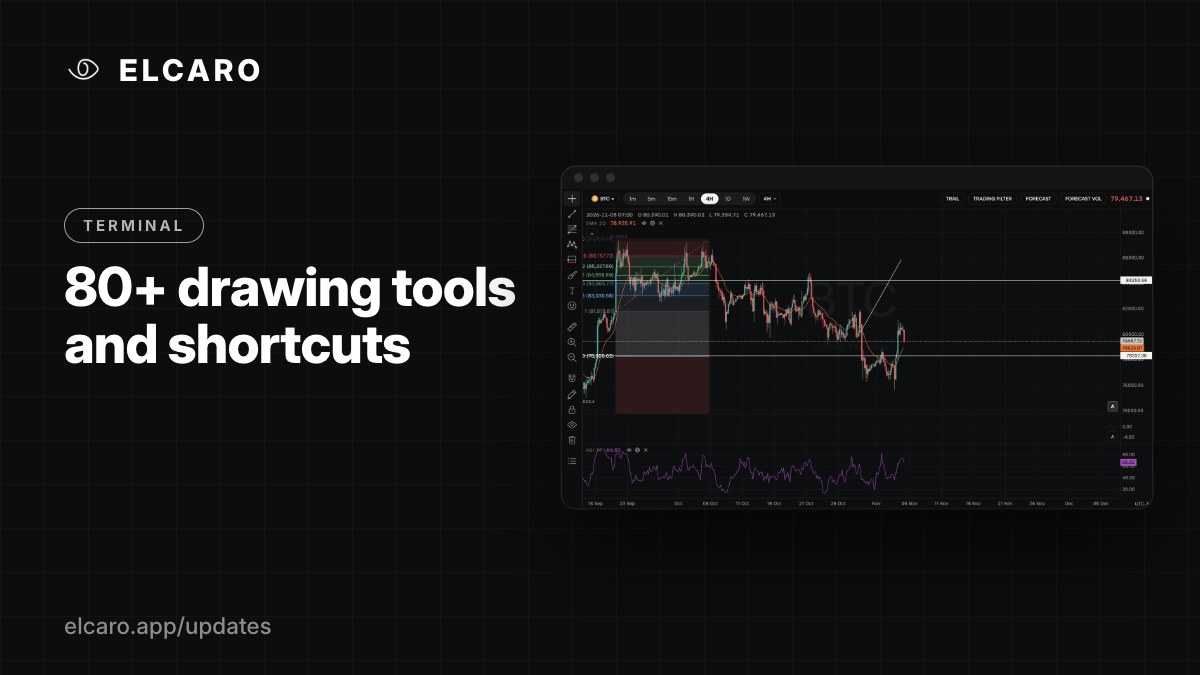
80+ drawing tools and shortcuts
Trend lines, channels, pitchforks, Fibonacci, Gann, patterns, Elliott waves, measurers, notes and more, with keyboard shortcuts.
Read more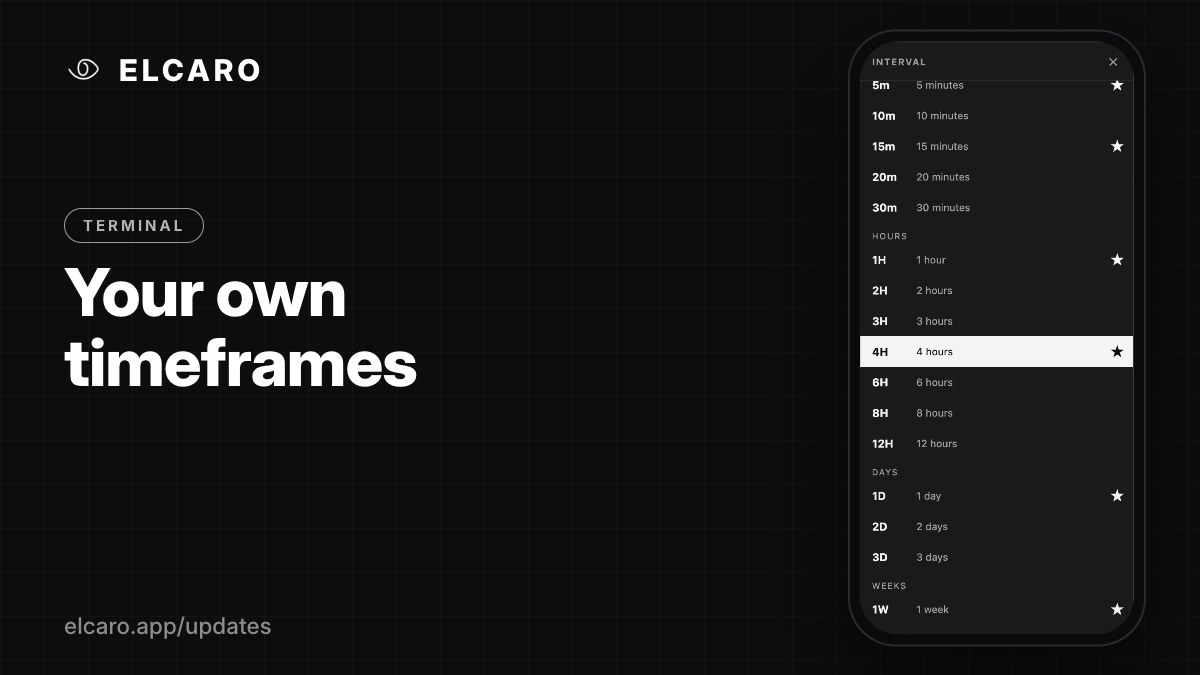
Your own timeframes
Beyond 1m to 1W: add 2m, 10m, 2h, 12h, 3D, 1M and more, and star the ones you use most.
Read more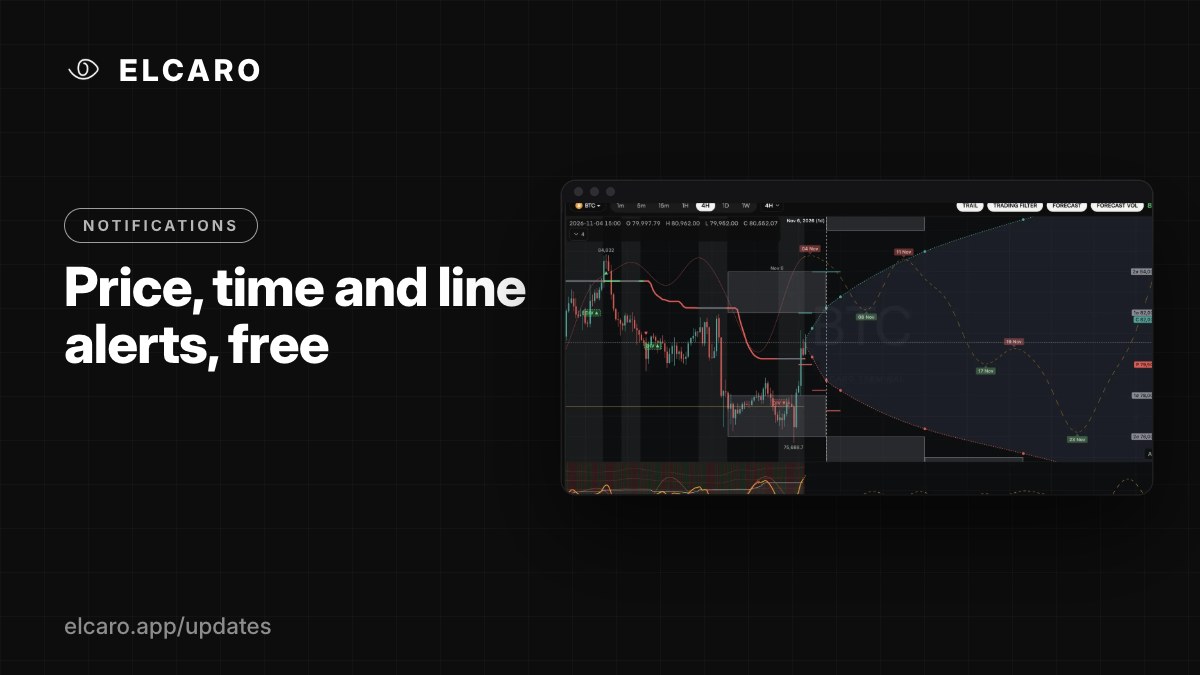
Price, time and line alerts, free
Every account can set alerts on a price level, a time or a drawn line, on any asset and timeframe, delivered to Telegram.
Read more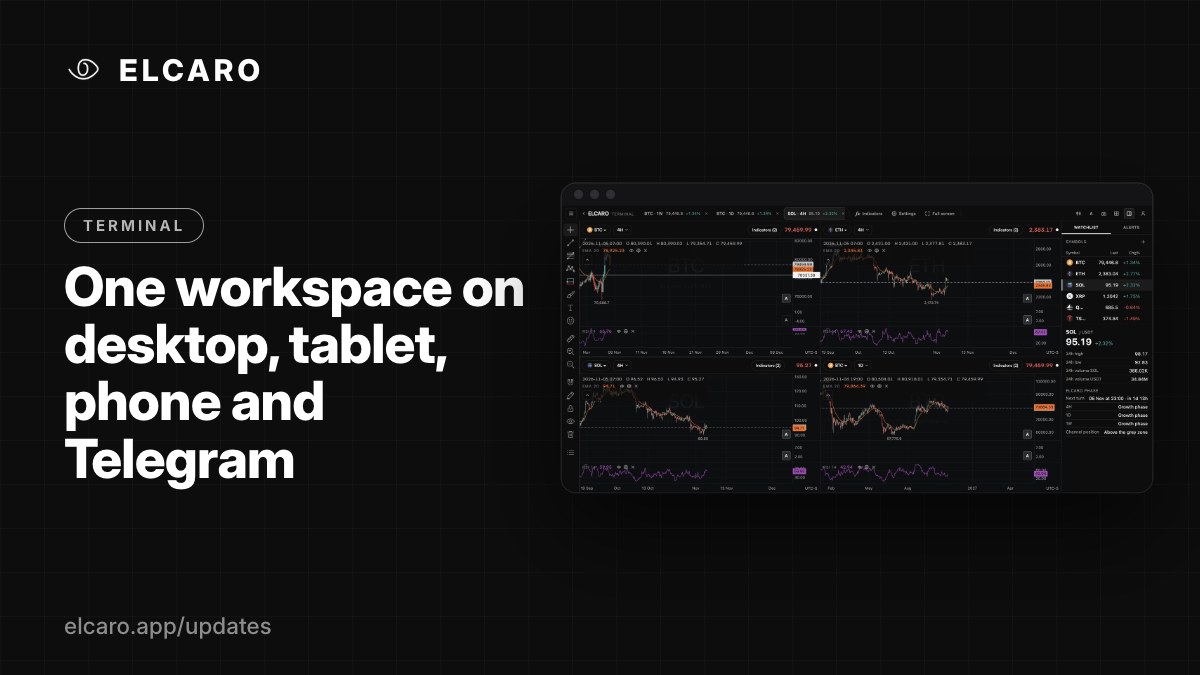
One workspace on desktop, tablet, phone and Telegram
The Terminal adapts to your screen and saves your workspace to your account, so you continue where you left off.
Read more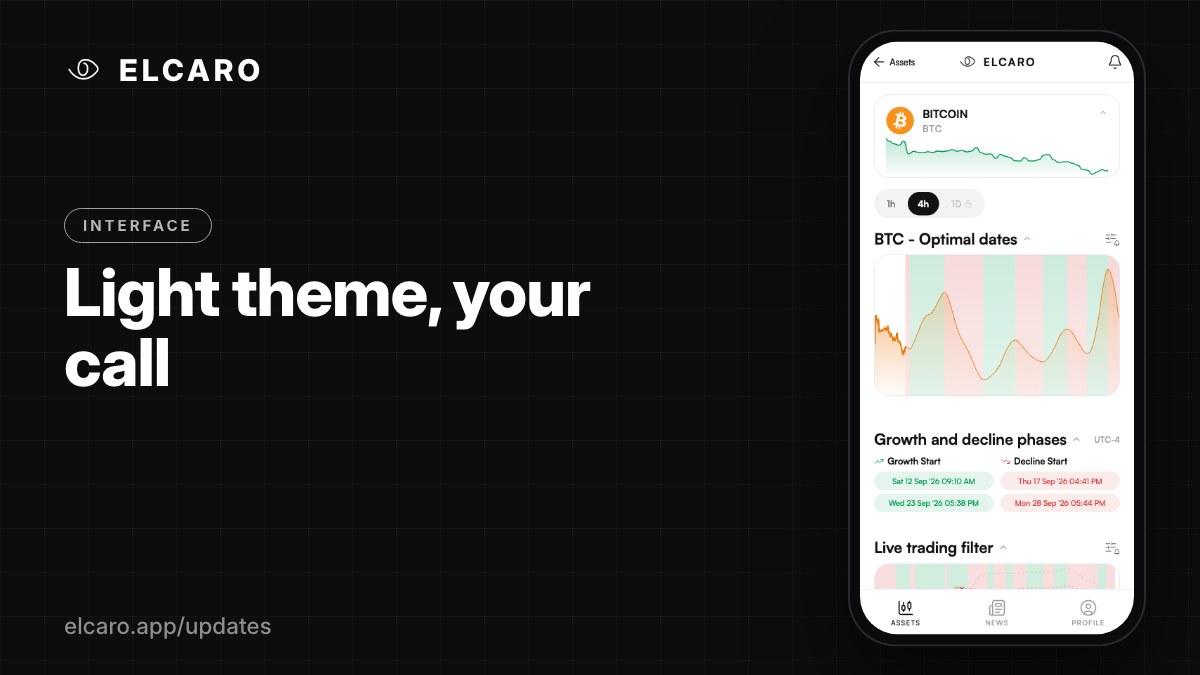
Light theme, your call
Switch ELCARO between dark, light and system in Options, and the whole app follows.
Read more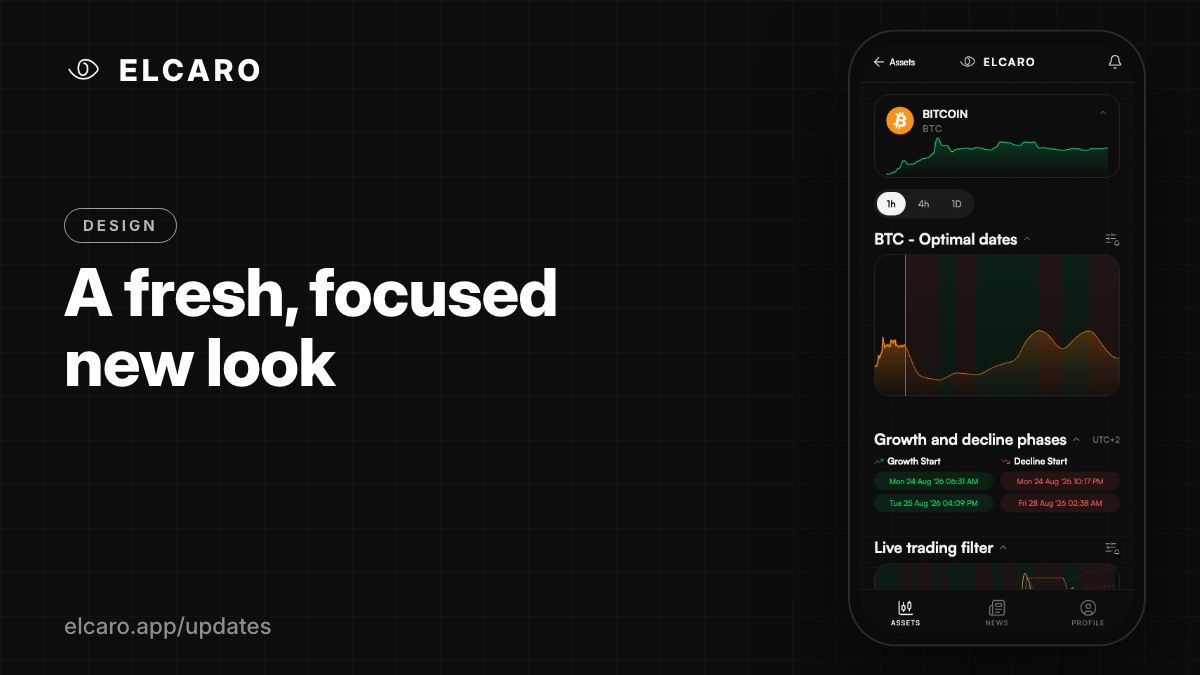
A fresh, focused new look
A cleaner, calmer design across ELCARO puts the forecast front and centre.
Read more
A built-in guide to reading forecasts
A full Help & Guide — with pictures and short clips — shows you how to read every part of ELCARO.
Read more
A guided tour, right in the app
Gentle hints walk you through each screen — what every part of the forecast means, one tap at a time.
Read more
Link Telegram and email into one account
Use ELCARO on Telegram and on the web as one account — sign in with both and they come together across your devices.
Read more
Videos play right inside News
Watch update and market videos without leaving the News tab.
Read more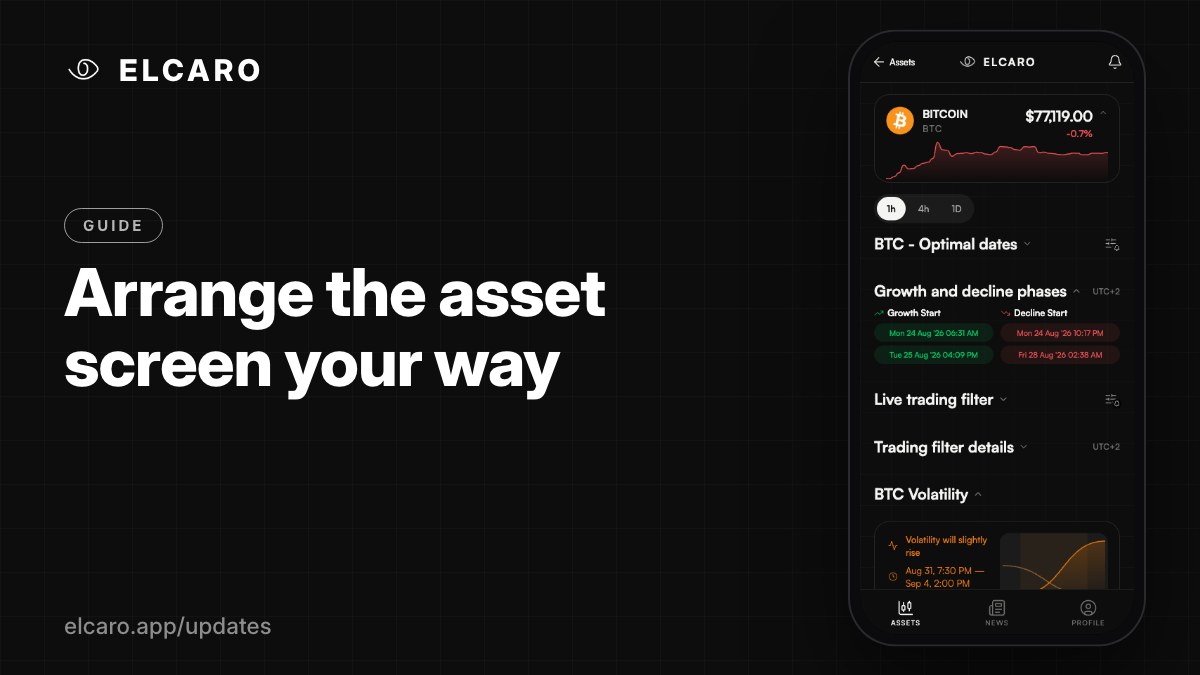
Arrange the asset screen your way
Collapse the blocks you do not need and keep the asset screen focused on what you watch.
Read more
A heads-up before your plan renews
A friendly reminder before your subscription renews, so a renewal is never a surprise.
Read more
Your data, fully in your hands
Delete your account and everything tied to it, right from the app, whenever you choose.
Read more
Pay yearly, save up to 30%
A professional forecasting tool on a professional schedule — every plan now has a yearly option, from $269 a year, with savings up to 30%.
Read more
Meet the Starter plan
Full Bitcoin coverage — forecasts on the 4-hour and daily timeframes — for $24.99 a month.
Read more
Full control of your subscription
Your account always shows where your plan stands — with a Manage Subscription button to update your card, renew, or cancel in one tap.
Read more
A major security and infrastructure upgrade
We’ve significantly strengthened ELCARO’s security and rebuilt the platform on hardened, privacy-first infrastructure we own and monitor around the clock — more private, more reliable and more secure.
Read more
Improved timezone coverage
More cities in the timezone picker and a smoother handling of dates across regions, so your forecast points and notifications read in the time you actually live in.
Read more
Your forecast, one tap away
Open the full AI Assistant directly from the bottom bar, no need to dive into an asset first.
Read more
A smoother support experience
Faster answers when you have a question, and a clear hand-off to a real person whenever you need extra help, all from the same chat.
Read more
A calmer experience if something goes wrong
If the app ever runs into an unexpected error, you get a calm recovery screen with a one-tap way back to where you were.
Read more
Liquid Glass: a new look for ELCARO
Wallpaper background, frosted-glass cards, glass bottom bar, frosted skeletons during loading. iOS 26 vibes, everywhere.
Read more
Accurate dates when you zoom in
The crosshair date stays in sync with growth and decline points on the chart, even when you're zoomed in close.
Read more
GDPR-compliant legal documents
Updated Terms, Privacy Policy and a Data Processing Addendum, all unified under /legal with an audit trail of acceptances.
Read more
A better fit on every screen
We improved how the app looks across devices: comfortable, focused layouts on phones, tablets and desktop browsers alike.
Read more
One wording across push, Telegram and in-app
Forecast phase and trading filter notifications read the same across push, Telegram and in-app, so you recognise an event at a glance.
Read more
Smoother sign-in experience
We improved how your account session works, so you stay signed in reliably and don't get logged out by random network blips.
Read more
Sign up in seconds
Smoother account creation with clearer feedback at every step.
Read more
Charts that load without the jump
The chart now glides into place with a gentle skeleton, and switching timeframes feels instant, no flashes, no jumps, no awkward gaps.
Read more
Email verification for email signups
New email registrations now have to confirm their address before they can use the app. This protects accounts and keeps the user base clean.
Read more
AI Assistant v3 explains every verdict
A single scored read of the algorithm's forecast, built from filter momentum, volatility, BTC dominance and total market cap, with a follow-up chat that keeps full history.
Read more
News tab open to every user
Curated news feed with AI-generated summaries and automatic chapter timestamps on YouTube videos, free for every user.
Read more
Live Trading Filter for every user
24 algorithmic event types, divergence, sigma crosses, channel breakouts, reversals, now visible in-app for every user.
Read more
A clearer price chart at a glance
See where the algorithm expects price to go, and where it expects momentum to flip, all on one chart, without switching screens.
Read more
TradingView indicator, renewals you won't miss
Buy or renew the indicator in one chat, and get clear reminders before access expires, so you never lose it by accident.
Read more
One account, every device
Your forecasts, watchlist, settings and subscription stay in sync across web, mobile and the Telegram Mini App, switch freely between them.
Read more
Send photos and files when you need help
Drop a screenshot, document or short video right into the chat, much easier than describing what's on your screen in words.
Read more
Get instant help, right in the chat
Type your question in the bot and get a smart, friendly answer in seconds, about anything from forecasts to your subscription.
Read more
1D timeframe unlocked for Platinum
Platinum subscribers now see the 1D timeframe in the Forecast modal, alongside the 1W silent context already used by the AI Assistant.
Read more
Fine control over your alerts
Choose exactly which assets you want to hear about, which kinds of moves matter to you, and on which channels. No more noise.
Read more
Have a promo code? Apply it in one tap
Discounts, extended access and special offers, codes activate instantly from your profile and tell you exactly what you're getting before you confirm.
Read more
More assets to follow
Hundreds of crypto, indices, stocks and commodities, with forecasts, the live trading filter and notifications across them all.
Read more
Three subscription tiers: Basic, Pro, Platinum
A clearer pricing ladder with tier-aware features, a 3-day free trial, promo codes and refund options on cancel.
Read more
Link Telegram to your email account
Have an email account and a Telegram Mini App account? Merge them in one tap, no support ticket needed.
Read moreNo updates in this category yet.