
Sigma levels: how stretched is the move?
The ±1σ, ±2σ and ±3σ lines on the trading filter show how unusual the current reading is. Here is how to read them.
What it gives you
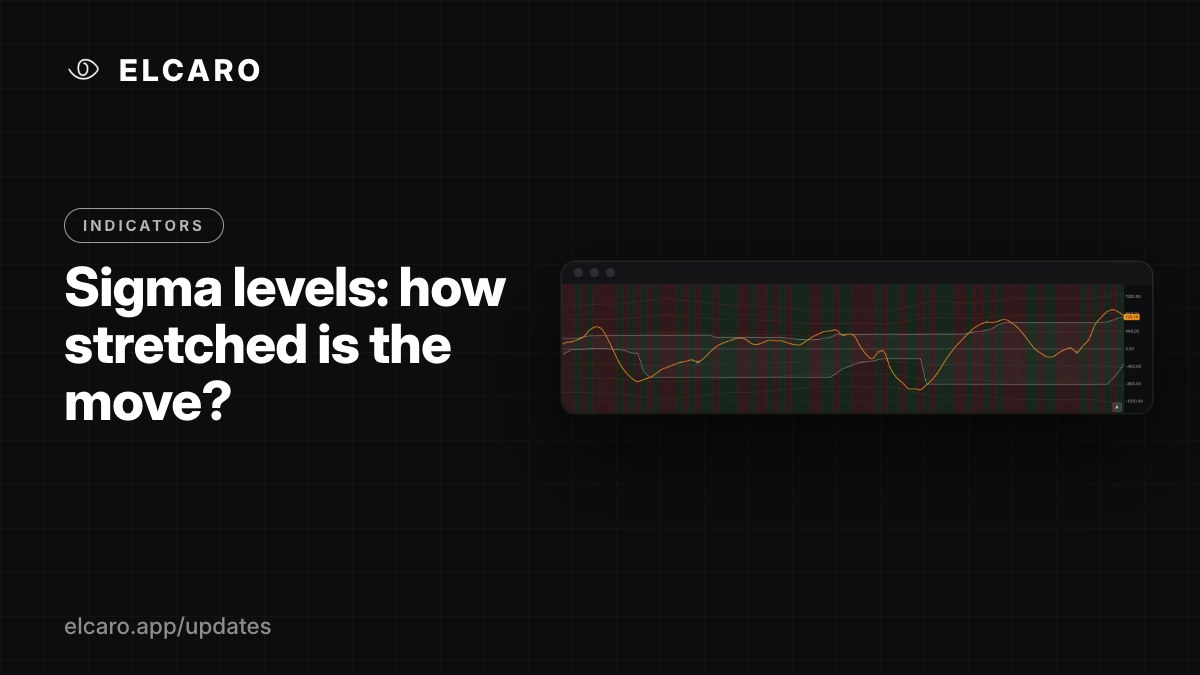
Sigma levels put a number on "stretched". They are dotted lines on the trading filter pane that compare the filter's current reading with its own recent behaviour.
What the lines are
σ1 is one standard deviation of the filter's own value over its last 100 bars. σ2 and σ3 sit at two and three times that distance, above and below the centre.
How to read them
- The filter normally stays inside ±σ1 about 68% of the time, inside ±σ2 about 95% and inside ±σ3 about 99.7%.
- So a reading beyond σ2 is a stretch seen only about 5% of the time.
- A rare stretch makes a pause or a turn more likely than usual, but it says nothing about when or how far. It is not a price target.
Read it with the forecast
Check the forecast dates first. A deep stretch late in a phase means more than one right after a phase begins.
Alerts on sigma levels
In Create alert, choose Filter (VOL) → Indicator line vs a level and pick +1σ … −3σ. You can also alert on VOL crossing a sigma line.
Good to know
These are not the σ boxes of ELCARO Options: those are drawn on the price and come from options prices.