
The trading filter and sigma levels
The trading filter pane step by step: VOL, the bands, the centre line, sigma levels, trend highlight, resizing the pane and alerts from a right-click.
The trading filter is ELCARO's oscillator in its own pane under the price chart. It shows the growth and decline phases and how stretched the move is.
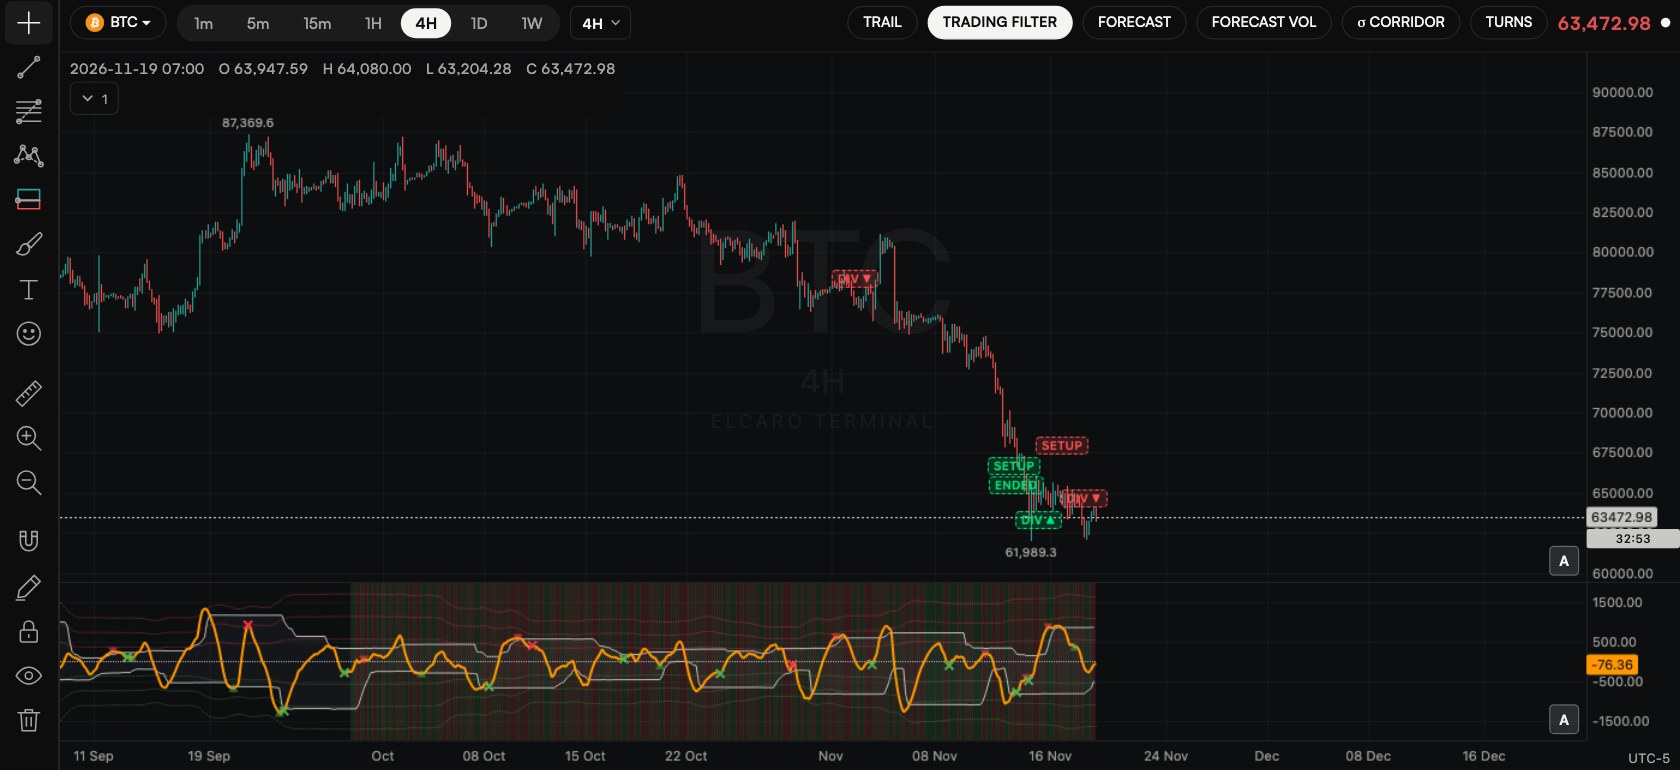
Switch it on
- Click the TRADING FILTER chip, or turn on ELCARO TRADING FILTER (VOL) in Indicators. Its settings window is called ELCARO VOL settings.
What you see
- VOL: the orange filter line.
- HighBand and LowBand: the upper and lower bands, with a filled channel between them.
- Centre line: dotted, in the middle.
- Sigma levels: dotted lines at +1σ, +2σ, +3σ above and −1σ, −2σ, −3σ below.
- Trend highlight (optional): a green or red background by phase.
- Divergence marks: small crosses and triangles; see Divergences in the Terminal.
How to read it
- VOL above the centre line leans to growth, below it to decline.
- VOL leaving the channel between the bands shows a strong move.
- Read it together with the forecast dates and TRAIL rather than on its own.
Sigma levels
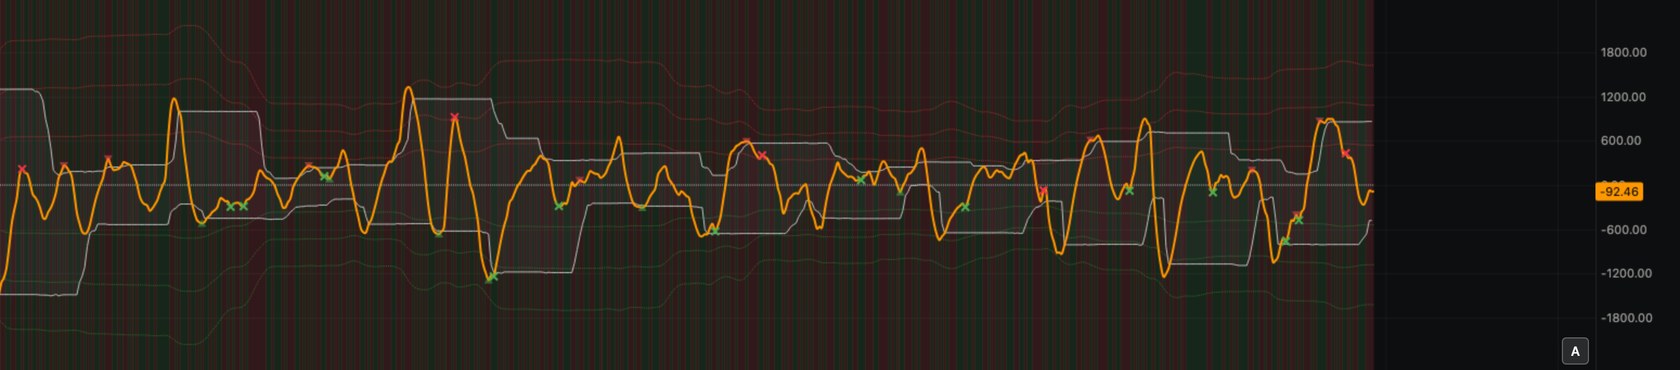
- σ1 is one standard deviation of the filter over its last 100 bars. σ2 and σ3 are two and three times that.
- The filter stays inside ±σ1 about 68% of the time, inside ±σ2 about 95% and inside ±σ3 about 99.7%.
- A move beyond σ2 is a stretch seen about 5% of the time.
- It is not a price target and it does not say when or how far the move will turn.
- These sigma levels are not the same as the options σ boxes on the price chart.
Make the pane bigger or smaller
- Drag the top edge of the pane up or down.
- Double-click the edge to return to the default height.
Settings
- Trend highlight: green or red background by phase.
- Divergence markers: DIV chips on the price chart where a divergence activates. On by default.
- Opacity and Restore defaults.
Alerts from a right-click
- Step 1. Right-click inside the trading filter pane.
- Step 2. Choose a ready alert: VOL crosses the centre line, the upper band (HB) or the lower band (LB), up or down; or a bullish or bearish divergence appears or activates.
- Step 3. Check the details and click Create.
For a sigma level, use Create alert → Filter (VOL) → Indicator line vs a level. Pick the line (VOL, a band, the centre line, any sigma level or TRAIL), the operator (crossing, crossing up, crossing down, greater than, less than) and the level.
In the news: trading filter in the terminal · sigma levels in the terminal
Read next
Divergences in the Terminal
Regular and hidden divergences on the trading filter, how they appear and activate, the DIV chips on the price chart and divergence alerts.
Forecast VOL in the Terminal
The forecast of the trading filter line: how to switch it on, where it is drawn, how to read it next to the price forecast, and its alert.
Sigma levels on the trading filter
What the σ1, σ2 and σ3 lines mean, why 68/95/99.7% describe how unusual a stretch is, and what they do not tell you.