
Forecast VOL in the Terminal
The forecast of the trading filter line: how to switch it on, where it is drawn, how to read it next to the price forecast, and its alert.
Forecast VOL is a forecast of the trading filter line itself. It shows the expected peaks and troughs of the filter ahead, with its own turn dates.
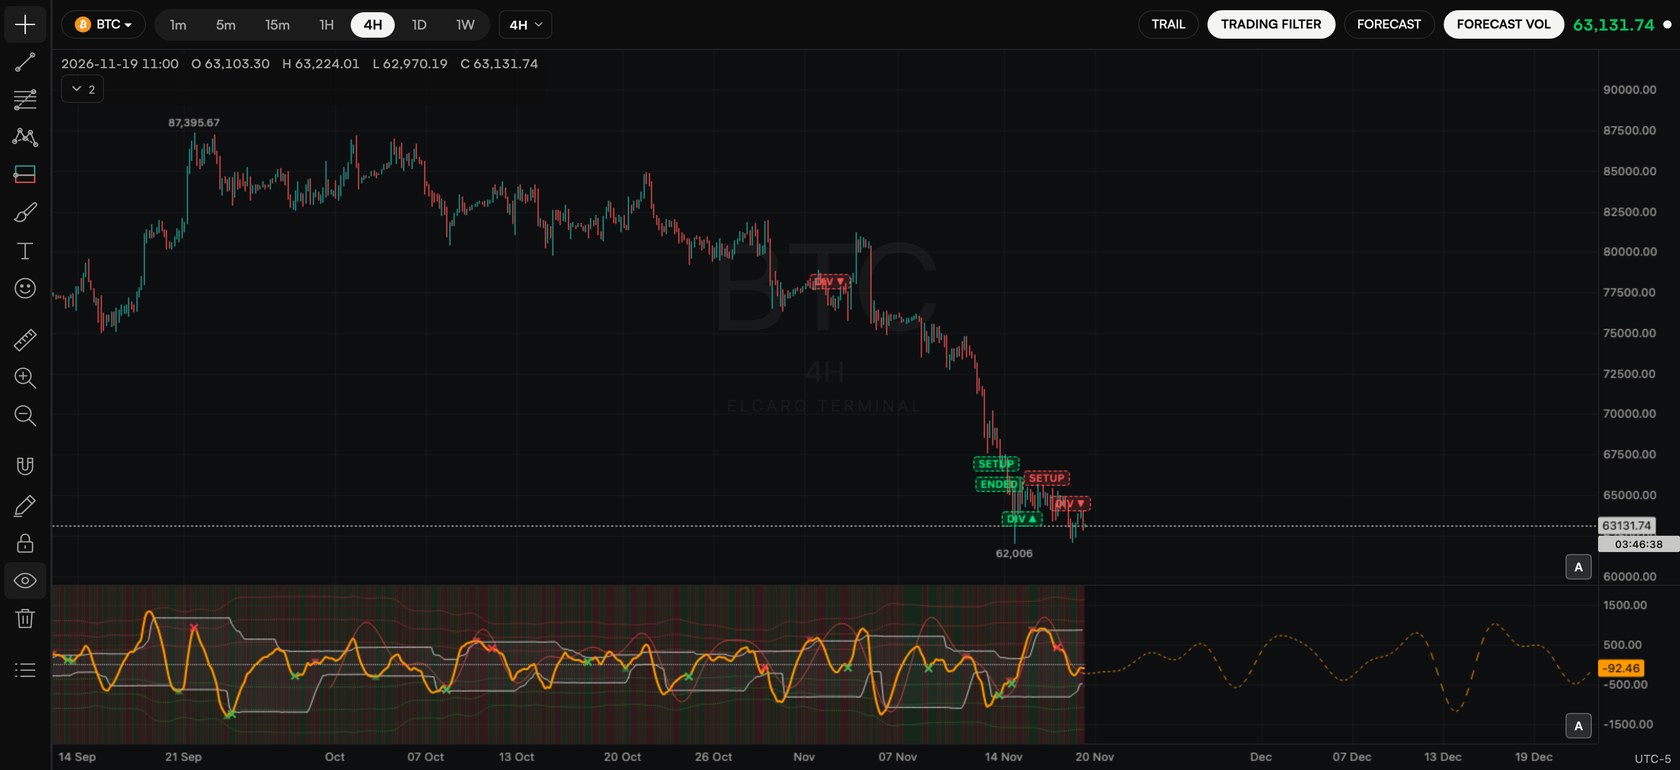
Switch it on
- Step 1. Turn on the trading filter (the TRADING FILTER chip or Indicators → ELCARO TRADING FILTER (VOL)).
- Step 2. Click the FORECAST VOL chip, or turn on ELCARO FORECAST VOL in Indicators.
- Step 3. A dashed curve continues the filter line to the right of the last bar, inside the filter pane.
How to read it
- Its peaks and troughs show where the filter is expected to turn.
- When the price forecast and Forecast VOL turn around the same time, the picture is easier to read; when they disagree, give the timing less weight.
- Like the price forecast, it shows timing and shape, not levels.
Settings
- Draw on the price chart: off keeps the curve in the trading filter pane. On draws it over the candles on its own scale.
- Turn dates: date chips at its turns. Off by default.
- Opacity and Restore defaults.
Alert
In Create alert → Forecast → FORECAST VOL turn, choose the turn and how many bars before (0 to 30; 0 means when it is reached).
In the news: forecast vol
Read next
ELCARO Forecast in the Terminal
How to switch the forecast on, read its solid and dashed parts, peaks and troughs, show turn dates, and set an alert before the next turn.
The trading filter and sigma levels
The trading filter pane step by step: VOL, the bands, the centre line, sigma levels, trend highlight, resizing the pane and alerts from a right-click.
Alerts in the Terminal
How to create every kind of alert step by step, what repeat, cooldown and expiry do, message templates, delivery to Telegram and the app, and the limits.