
All updates
 Full guide Forecast VOL in the Terminal
Forecast November 6, 2026
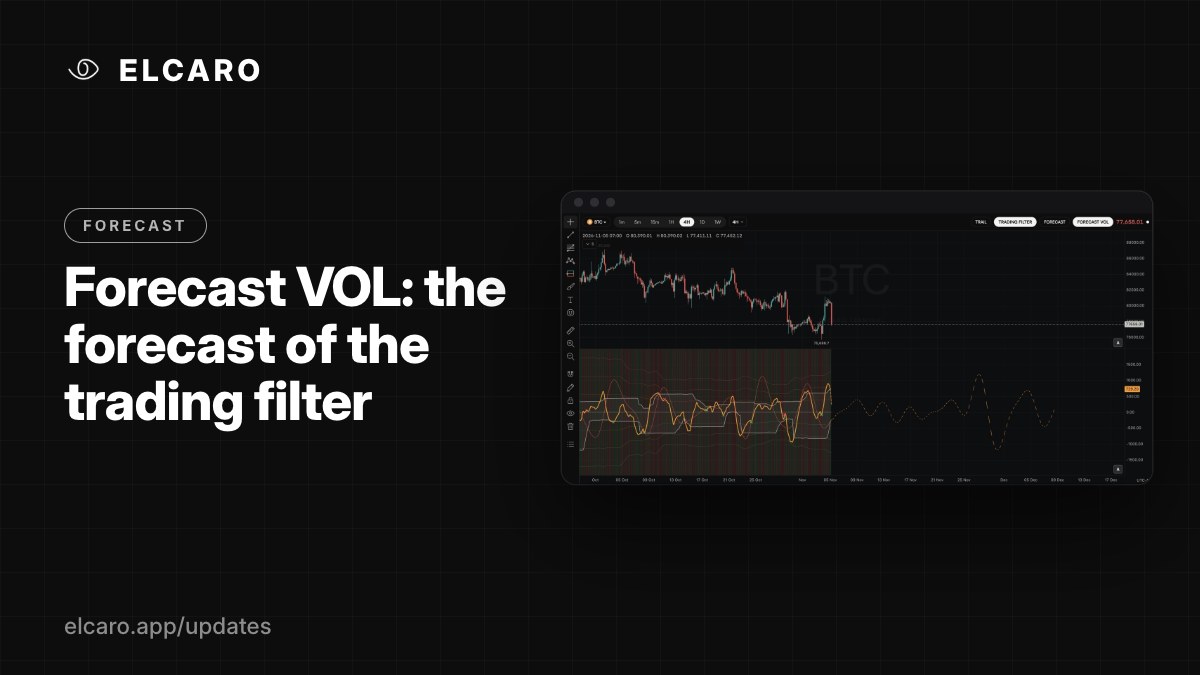
Forecast VOL: the forecast of the trading filter
A forecast curve for the trading filter line, with its own turning dates. Keep it in the filter pane or draw it over the price.
What it gives you
Forecast VOL applies the ELCARO forecast to the trading filter line instead of the price. It shows where the filter is expected to peak and bottom out next, so you can see the momentum side of the cycle ahead of time.
How to read it
- By default the curve sits inside the trading filter pane, next to the filter line it forecasts.
- Peaks and troughs of the curve are the expected turns of the filter.
- Like the price forecast, it shows timing and shape, not levels.
How to switch it on
Indicators → ELCARO → ELCARO FORECAST VOL, or the FORECAST VOL chip in the chart header.
Settings
- Draw on the price chart: move the curve from the filter pane onto the candles, on its own scale.
- Turn dates: date chips at each turn, off by default.
- Opacity.
Good to know
Forecast VOL has its own alert: FORECAST VOL turn, from 30 bars before the turn up to the moment it is reached.