
ELCARO Forecast in the Terminal
How to switch the forecast on, read its solid and dashed parts, peaks and troughs, show turn dates, and set an alert before the next turn.
The Forecast draws ELCARO's algorithmic forecast of the price path over your chart: where the asset has been in its cycle and the shape of the path ahead, on the timeframe you are looking at.
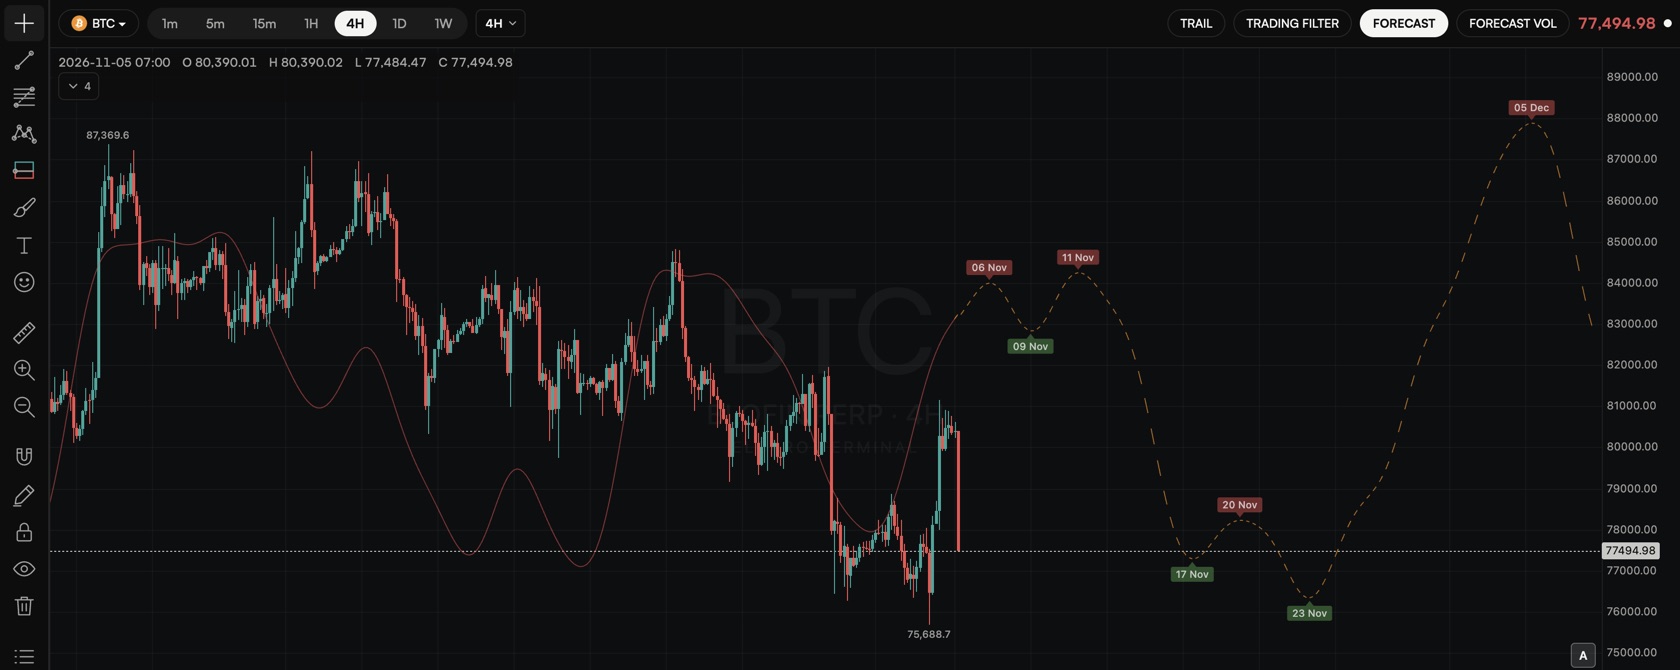
Switch it on
- Step 1. Pick an asset and timeframe your plan covers.
- Step 2. Click the FORECAST chip in the chart header, or open Indicators and turn on ELCARO FORECAST.
- Step 3. The curve appears over the candles.
What you see
- The solid thin part runs along closed bars. It shows the cycle the forecast has been following.
- The dashed part starts after the last candle. It is the path ahead.
- The curve has its own scale. It shows timing and shape, not price levels, so its height does not mean a target price.
How to read it
- A peak on the curve marks the start of a decline phase.
- A trough marks the start of a growth phase.
- Read the dashed part as "when", not "how far": it shows where the next turns are expected in time.
- Each timeframe has its own cycle. The 1H and 1D forecasts can show different turns, and that is normal.
- It helps to read the forecast together with TRAIL and the trading filter.
Show turn dates
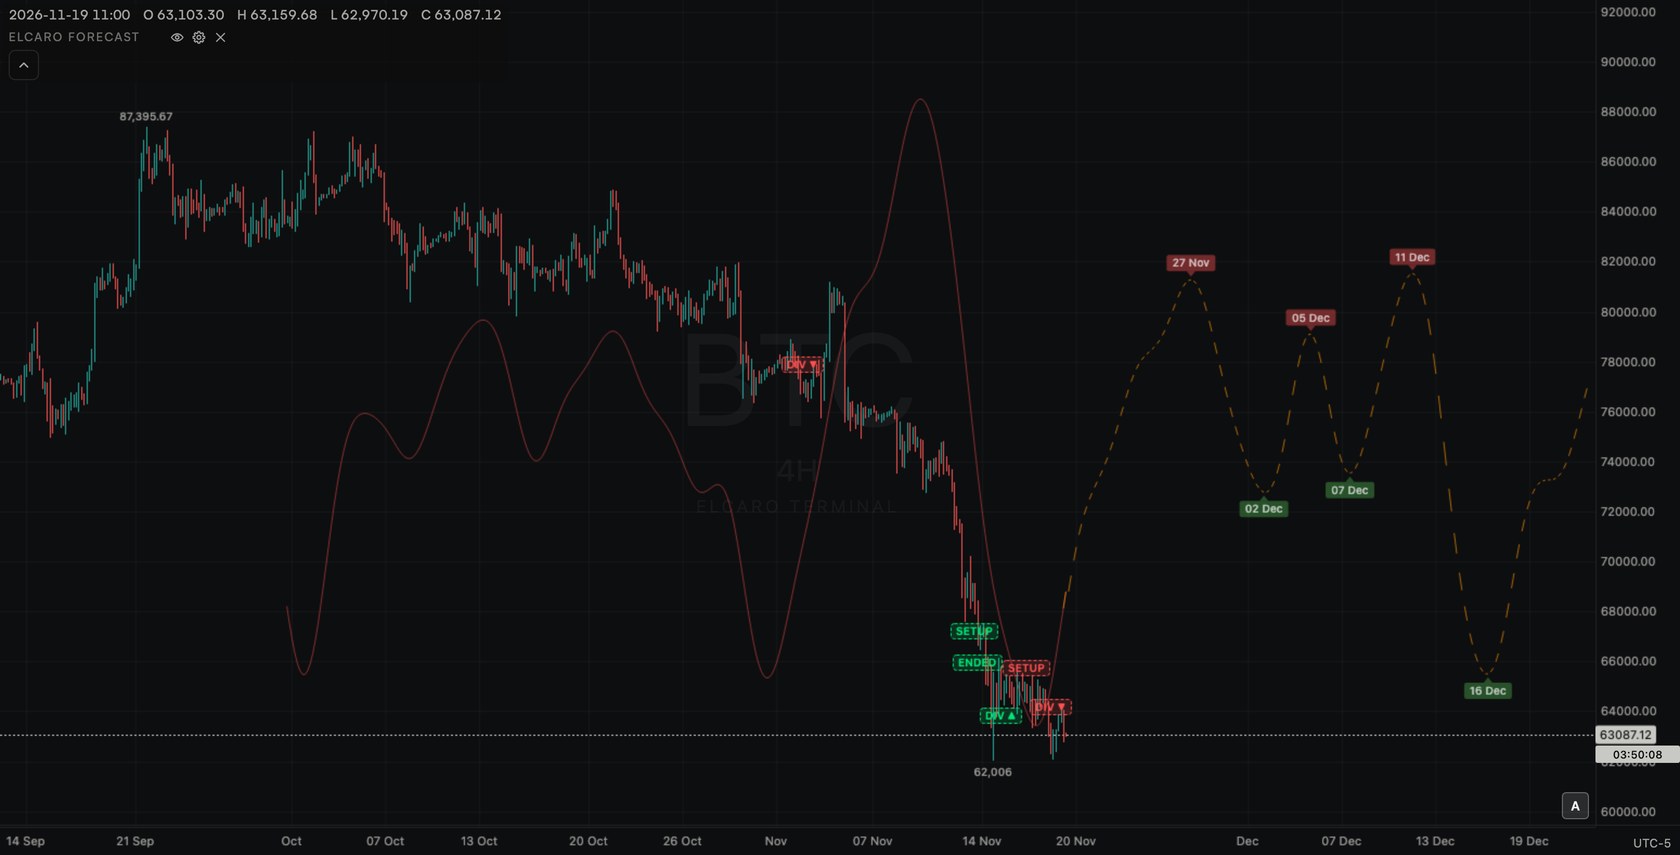
- Step 1. Open Indicators and click Settings on ELCARO FORECAST (or click the gear on its legend row).
- Step 2. Turn on Turn dates.
- Step 3. Date chips appear at the peaks and troughs. Hover a chip to see the full date and time.
Dates are shown in your time zone. To change it: Settings → Symbol → time zone.
Settings
- Turn dates: date chips at the turns. Off by default.
- Opacity: how strongly the curve is drawn.
- Restore defaults.
Set an alert before a turn
- Step 1. Open the ALERTS tab in the right panel and click Create alert.
- Step 2. Choose the asset and timeframe, then the Forecast group.
- Step 3. Choose Forecast turn approaching, pick Any turn, Peak or Trough, and set how many bars before (1 to 30).
- Step 4. Click Create. Or choose Forecast turn reached to hear about it when the turn comes.
Good to know
- The forecast needs enough history. With a short history you see "Reduced forecast"; with too little it is not drawn.
- It is not drawn on the monthly frame.
- On a chart outside your plan the forecast is not shown.
In the news: forecast in the terminal · forecast turn dates · guide elcaro indicators
Read next
Forecast VOL in the Terminal
The forecast of the trading filter line: how to switch it on, where it is drawn, how to read it next to the price forecast, and its alert.
Alerts in the Terminal
How to create every kind of alert step by step, what repeat, cooldown and expiry do, message templates, delivery to Telegram and the app, and the limits.
Reading the forecast
What the forecast dates mean, and why they can move by a day or two.