
All updates
 Full guide ELCARO Forecast in the Terminal
Forecast November 6, 2026
The ELCARO forecast in the Terminal
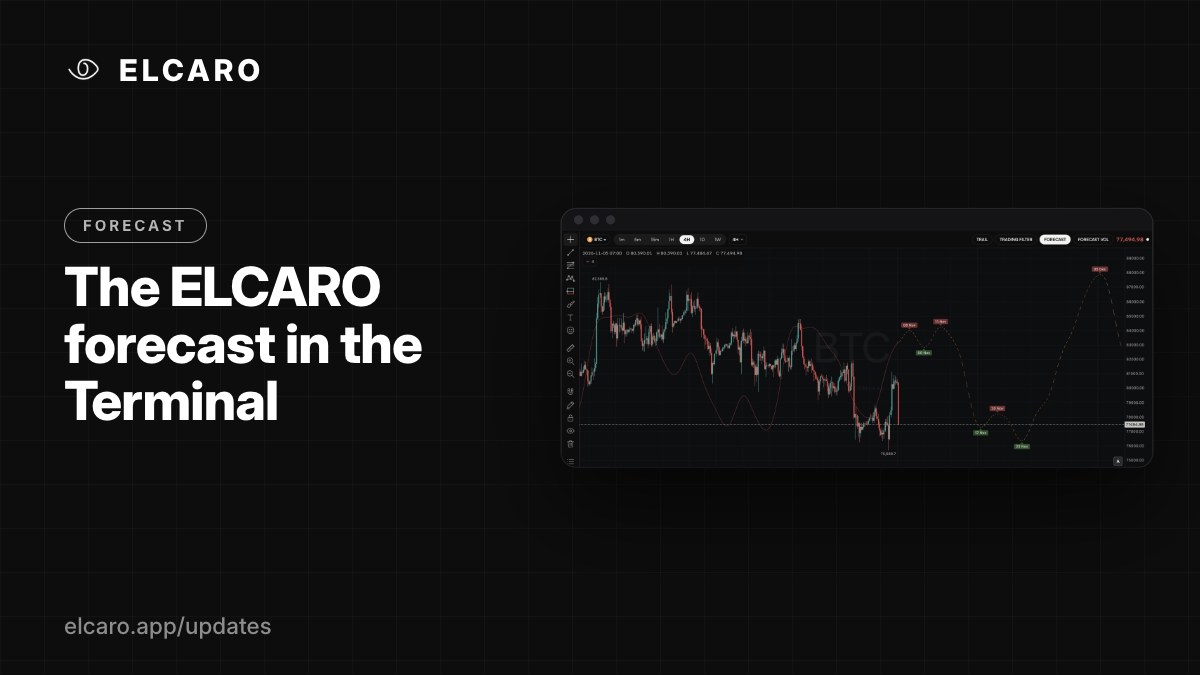
The expected path of the price, drawn over the candles: a solid fitted part, a dashed part ahead, and the turns that start each phase.
What it gives you
The Forecast draws ELCARO's algorithmic forecast of the price path right over your chart. You see where the asset has been in its cycle and the shape of the path ahead, on the timeframe you are looking at.
How to read it
- The solid thin line is the forecast fitted to the bars already closed.
- The dashed line to the right of the last candle is the path ahead.
- A peak marks the start of a decline phase. A trough marks the start of a growth phase.
- The curve has its own scale. It shows timing and shape, not price targets: a trough does not say how low the price will go, only when the growth phase is expected to begin.
How to switch it on
Indicators → ELCARO → ELCARO FORECAST, or click the FORECAST chip in the chart header. Open Settings on the row to change its opacity.
Good to know
- The forecast needs enough history. On a young asset or a short custom interval you may see "Reduced forecast" or "not enough history".
- It is not drawn on the monthly frame.
- It is calculated for the timeframe of the chart, so 1h and 1D show different cycles. That is expected: each timeframe has its own rhythm.