
Reading the forecast
What the forecast dates mean, and why they can move by a day or two.
The forecast marks where a growth phase is expected to turn into a decline phase, and back. Those turning points are what the dates on the asset page refer to.
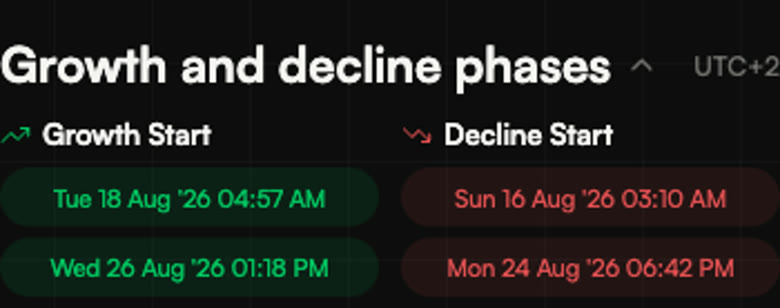
The dates are a window, not a moment
The model recalculates continuously as new data arrives. Peaks and troughs stay where they are, but the exact date attached to them can shift by a day or two on higher timeframes, or an hour or two on lower ones.
That movement is the model working, not the model failing. A forecast that never adjusted would be a forecast that stopped reading the market.
Read from the top down
Start on the highest timeframe you have access to and work downwards. The higher frame tells you which phase you are in; the lower frame refines when inside it.
What you should not do is build a separate, independent forecast on each timeframe and then wonder why they disagree. There is one forecast — the lower timeframes only sharpen its timing.
Accuracy
No forecast is a promise. Treat the dates as the model's current best reading, and expect it to be revised as the market moves.
Watch it on a chart
Read next
How timeframes fit together
Why the same asset looks different on 1h and 1D, and why you read them top down.
Why a growth phase still has falling days
The single most common question about the forecast, answered with the weather.
Reading the trading filter
The channel, its levels, the zero line — and what an event actually records.