
Reading the trading filter
The channel, its levels, the zero line — and what an event actually records.
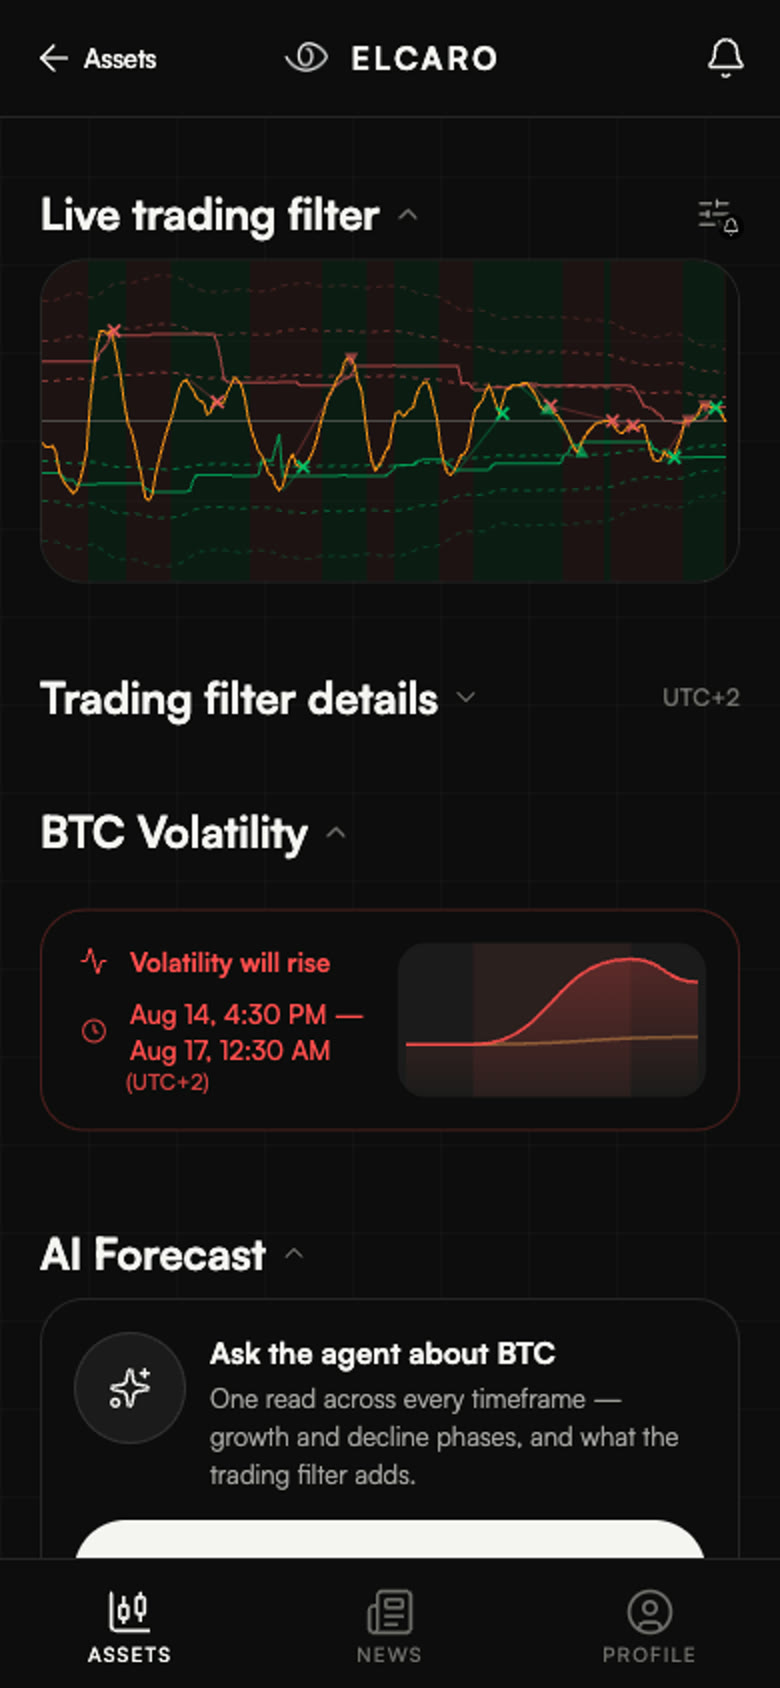
The trading filter is the oscillator drawn under the price. It measures how far the price has stretched from its own dynamic channel — a band that the filter recalculates from the market itself, with nothing for you to configure.
The parts of it
- The curve is the current reading.
- The upper and lower bands are the edges of the channel. They move with volatility, so they are not fixed levels.
- The zero line is the middle. Which side of it the curve sits on tells you which way the current stretch is leaning.
What an event is
Every time the curve crosses one of the channel's levels, the app records an event and lists it under the chart. An event is a factual record — this asset, this timeframe, this level, at this moment. It is a description of what the filter did, not an instruction.
The channel is per timeframe
The filter describes the swings of the timeframe you are looking at. On a higher timeframe the swings are wider and rarer; on a lower one they are narrower and far more frequent. The same asset can sit near the top of its channel on one timeframe and near the bottom on another, and both readings are correct.
Watch it on a chart
Read next
Divergences, regular and hidden
When the price and the filter disagree — and why those moments are marked separately.
The event list and the chart
How the list and the chart are linked, and what the time on an event means.
How timeframes fit together
Why the same asset looks different on 1h and 1D, and why you read them top down.