
The event list and the chart
How the list and the chart are linked, and what the time on an event means.
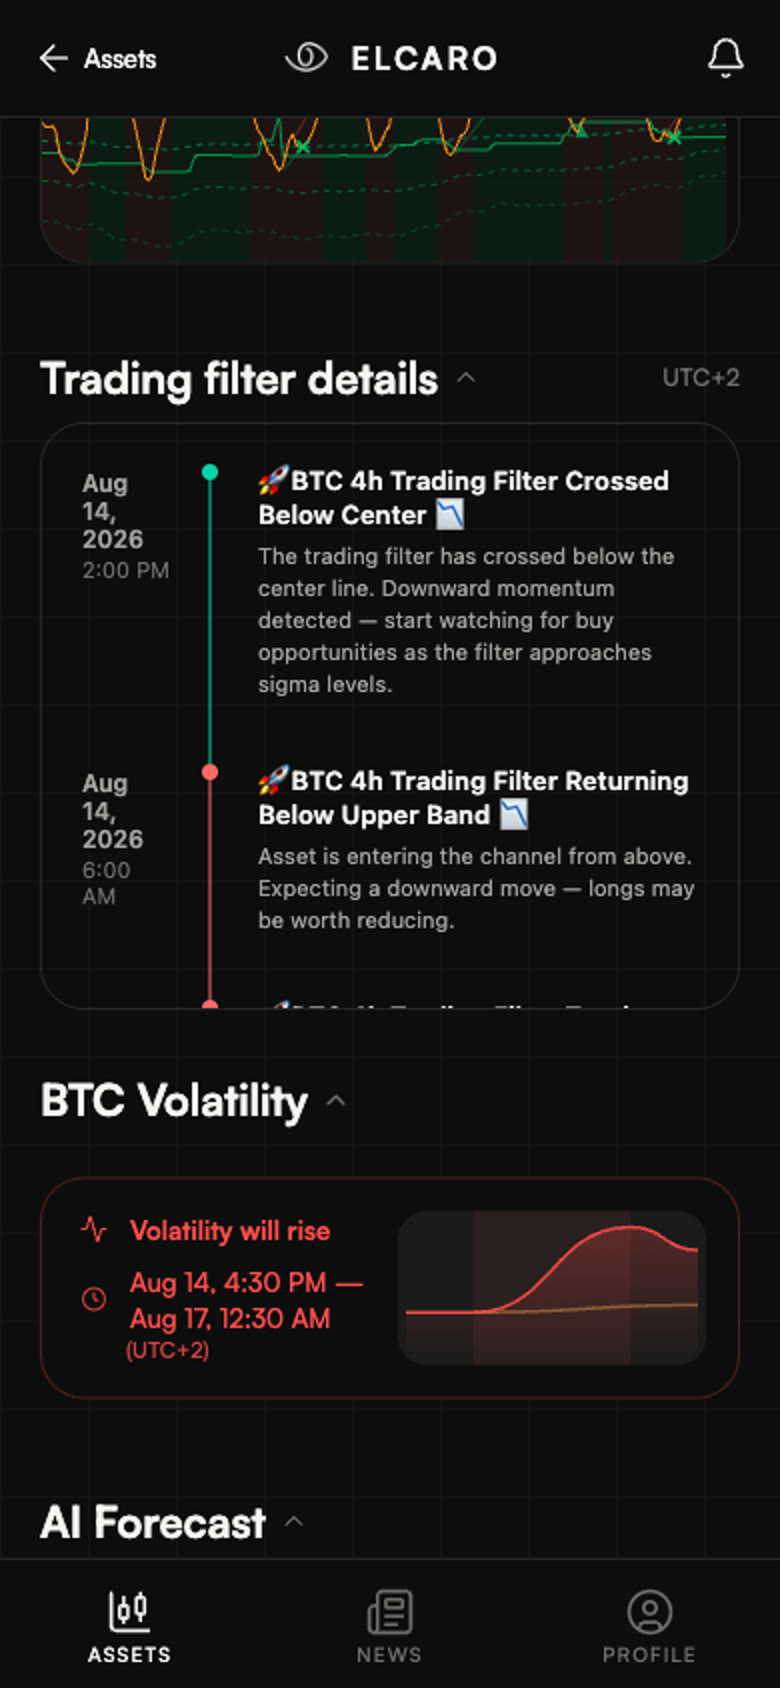
Under the trading filter you get the full history of its events for the asset and timeframe you are looking at — not just the most recent ones. The list and the chart are drawn from the same data, so what you read in one you can find in the other.
Tapping between them
Tap a record in the list and the chart cursor moves to the candle it belongs to. Move the cursor along the chart and every record on that candle is highlighted in the list. The two are always in step.
The time on an event
Every event is stamped with the moment its candle closed — the point at which the data was complete and the event could be stated as a fact. That is the same time you see in the chart tooltip.
This is worth knowing when you compare timeframes: a 4h event and a 1h event that look simultaneous on the chart carry different stamps, because their candles close at different moments.
The details block
The event history sits under the chart as its own block with its own scroll, so you can work through a long history without losing the chart above it. Like every block on the page, it folds away when you don't need it.