
The trading filter, in its own pane
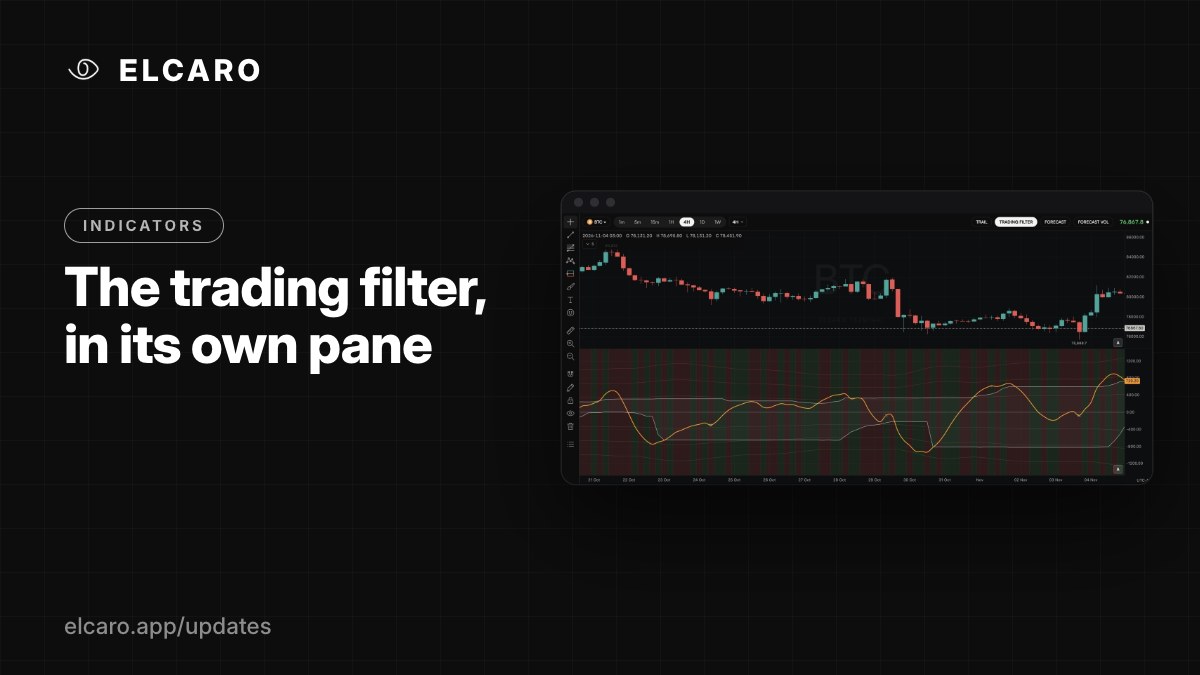
The VOL oscillator with its bands, centre line, sigma levels and phase highlight, under every chart you open.
What it gives you
The ELCARO trading filter is the oscillator behind the app's growth and decline phases. In the Terminal it gets a full pane under the price chart, so you can read it bar by bar on any timeframe your plan covers.
What you see
- The VOL line (orange): the filter itself.
- HighBand and LowBand with a filled channel between them.
- A dotted centre line.
- Dotted sigma levels at ±1σ, ±2σ and ±3σ.
- Optional trend highlight: a green or red background by phase.
- Divergence marks (more on those in two days).
How to read it
VOL crossing the centre line is a change of momentum. Moves beyond the bands and sigma levels show how stretched the move is. The phase highlight lets you see growth and decline stretches at a glance.
How to switch it on
Indicators → ELCARO → ELCARO TRADING FILTER (VOL), or the TRADING FILTER chip. Drag the top edge of the pane to resize it; double-click to reset.
A shortcut for alerts
Right-click the filter pane for ready-made alerts: VOL crossing the centre line, the upper or lower band, and divergences appearing or confirmed.