
All updates
 Full guide TRAIL and higher-timeframe trail levels
Indicators November 6, 2026
TRAIL: a level that follows the trend
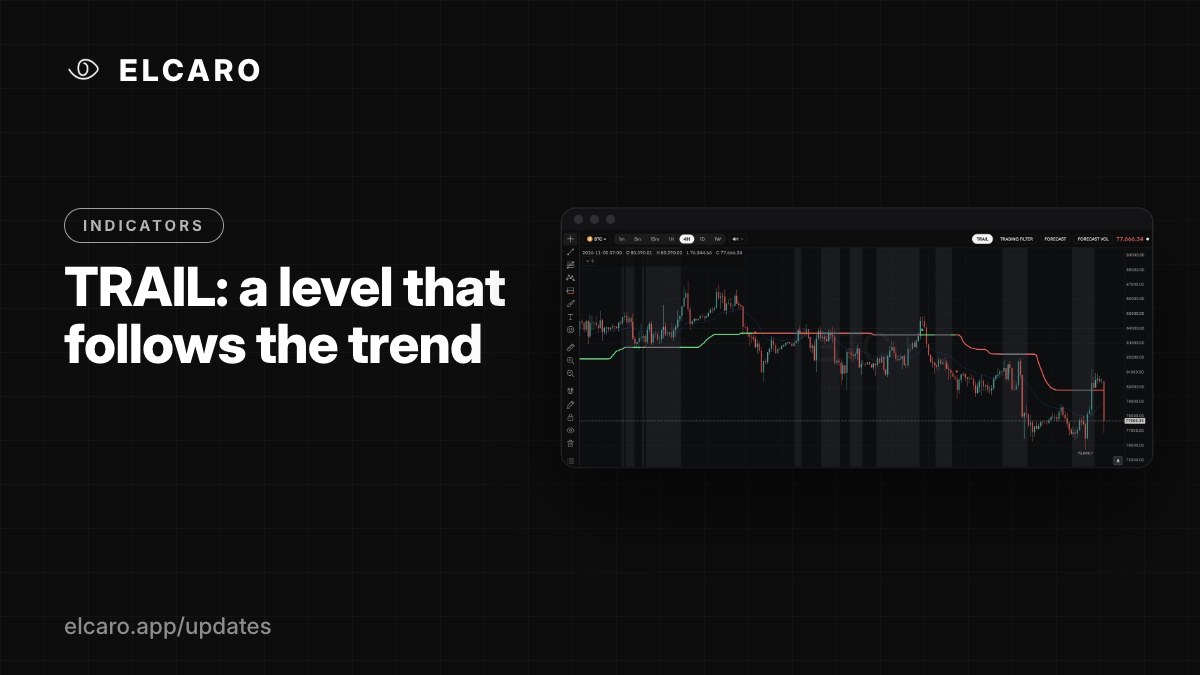
A stepped line on the price chart that changes colour with the phase, flips when the trend turns and marks the grey zone.
What it gives you
TRAIL is a stepped level that follows the move. It stays below the price in a growth phase and above it in a decline phase, so at a glance you see which side of the trend the market is on and where that side would be broken.
How to read it
- Colour = phase. The line takes the growth colour or the decline colour. It turns grey in the grey zone, where the trend is undecided; there it keeps its previous side.
- A flip is when TRAIL moves to the other phase. Small triangle markers show where it turned.
- A cross is a bar closing on the other side of the line.
- The thin blue inner line is a smoothed average of recent closes that adapts to how trending the market is.
How to switch it on
Indicators → ELCARO → ELCARO TRAIL, or the TRAIL chip in the chart header.
Settings
Adaptive line (colour follows direction), markers where the trail turns, grey background, inner line, opacity, and the higher-timeframe levels covered in the next post.
Good to know
Two alerts follow TRAIL: TRAIL flips phase and Price crosses TRAIL. Both are checked when the bar closes.