
TRAIL and higher-timeframe trail levels
How TRAIL follows the trend, what a flip, a cross and the grey zone mean, how to show the 1H, 4H, 1D and 1W trail on one chart, and TRAIL alerts.
TRAIL is a stepped level that follows the trend on the price chart. It tells you which phase the asset is in and where that phase would be broken.
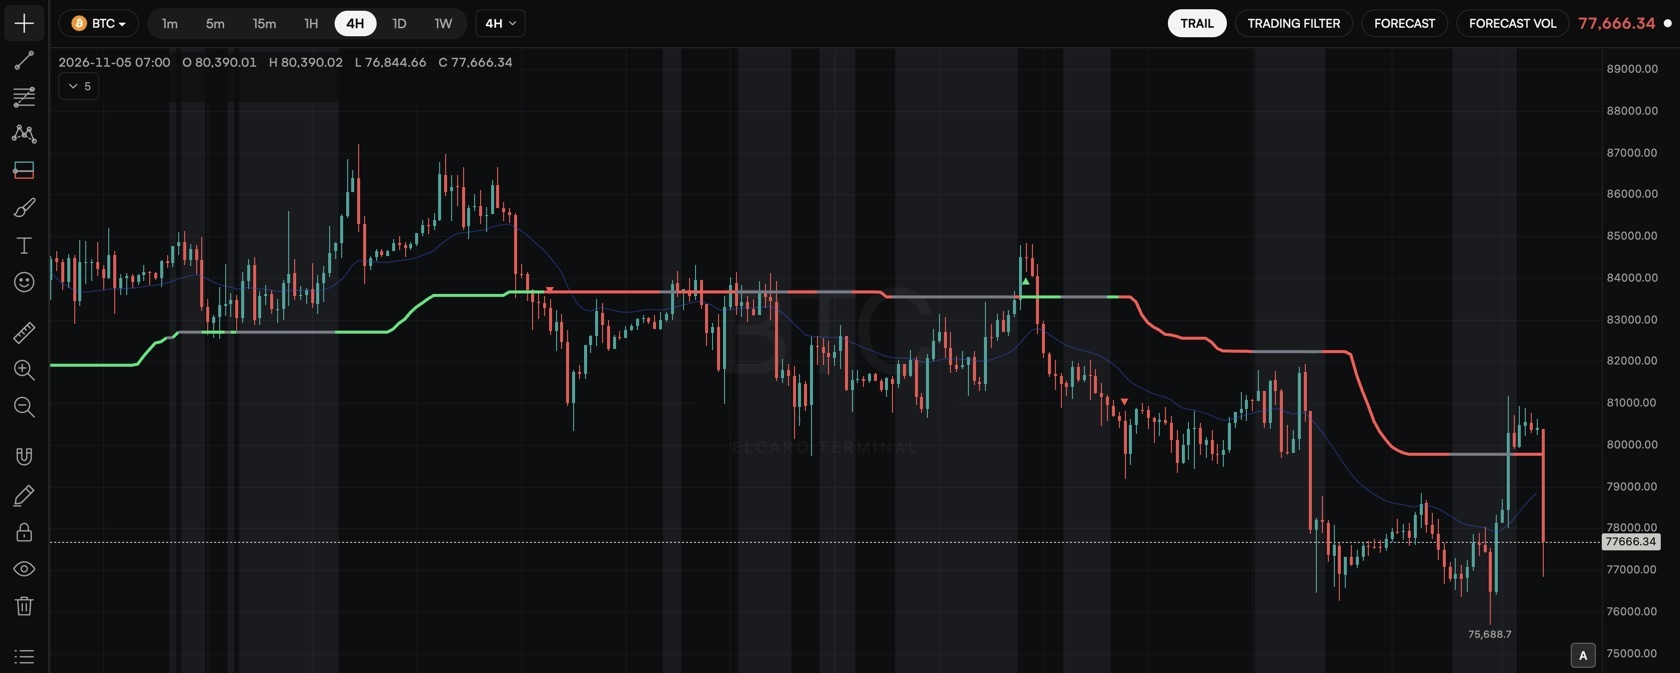
Switch it on
- Click the TRAIL chip in the chart header, or turn on ELCARO TRAIL in Indicators.
What you see
- The trail line: a stepped level. It takes the growth colour or the decline colour.
- The grey zone: the line turns grey (and, if you choose, the background too) while the trend is undecided.
- Turn markers: small triangles where the trail turns.
- The inner line: a thin blue line, a smoothed average of recent closes that adapts to how strongly the market is trending.
How to read it
- Phase: TRAIL is either on the growth side or on the decline side.
- Flip: TRAIL moves to the other phase. This is the moment the trend changes by TRAIL.
- Cross: a bar closes on the other side of the line.
- Grey zone: the trend is undecided. TRAIL keeps its previous side until the picture clears.
Settings
- Adaptive line (colour follows direction).
- Markers where the trail turns.
- Grey background.
- Inner line.
- Opacity and Restore defaults.
- Higher timeframe levels (below).
Higher-timeframe trail levels
See the TRAIL of bigger timeframes on the chart you are on, without switching charts.
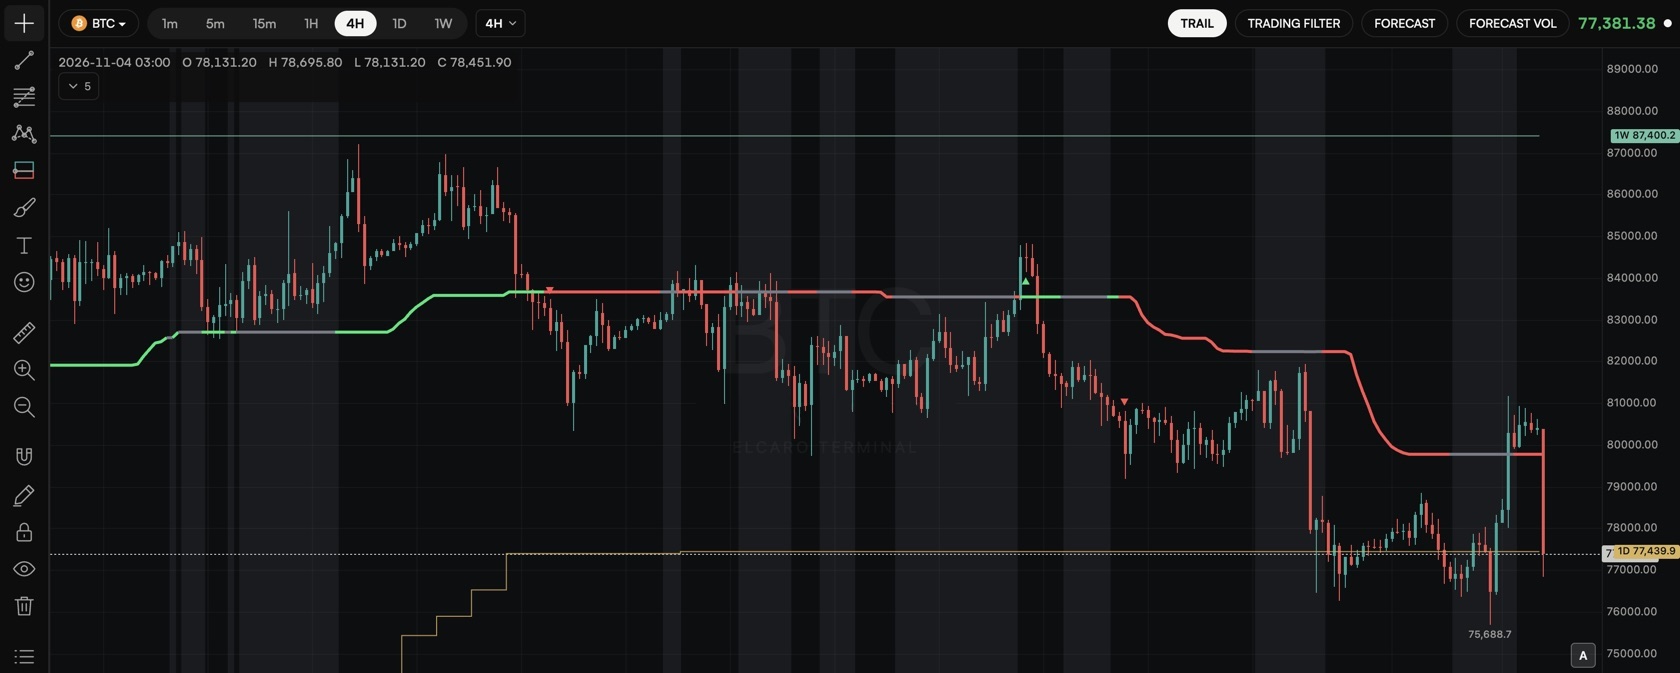
- Step 1. Open the settings of ELCARO TRAIL (Indicators → Settings, or the gear on its legend row).
- Step 2. In Higher timeframe levels, turn on Show on the price chart.
- Step 3. Choose the levels: 1H trail level, 4H trail level, 1D trail level, 1W trail level. By default 4H, 1D and 1W are on.
- Step 4. Each level appears as a step line with a price tag. The colour stands for the timeframe, not the direction.
Only timeframes above the chart's own are drawn: on a 4H chart you can see 1D and 1W, but not 1H. Each level shows if its own timeframe is in your plan.
TRAIL alerts
- TRAIL flips phase: to growth, to decline, or either.
- Price crosses TRAIL: up, down, or either way.
Create them in ALERTS → Create alert → group TRAIL. They are checked when a bar closes.
In the news: trail · higher timeframe trail levels
Read next
ELCARO Forecast in the Terminal
How to switch the forecast on, read its solid and dashed parts, peaks and troughs, show turn dates, and set an alert before the next turn.
The trading filter and sigma levels
The trading filter pane step by step: VOL, the bands, the centre line, sigma levels, trend highlight, resizing the pane and alerts from a right-click.
Alerts in the Terminal
How to create every kind of alert step by step, what repeat, cooldown and expiry do, message templates, delivery to Telegram and the app, and the limits.