
All updates
 Full guide TRAIL and higher-timeframe trail levels
Indicators November 6, 2026
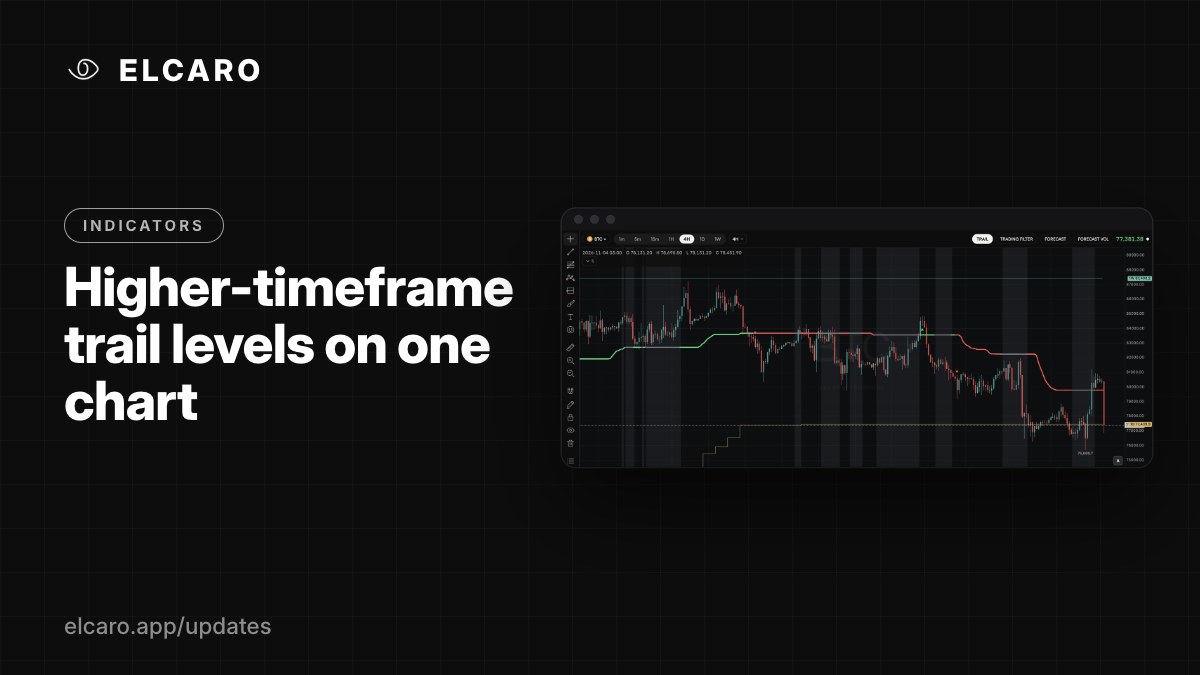
Higher-timeframe trail levels on one chart
See the TRAIL of 1H, 4H, 1D and 1W as step lines on a lower-timeframe chart, without switching charts.
What it gives you
The bigger picture usually lives on a higher timeframe. Higher-timeframe trail levels bring it to your chart: the TRAIL of 1H, 4H, 1D and 1W is drawn as step lines with a price tag, so on a 1h chart you see where the 4h, daily and weekly trails sit.
How to read it
- Each line is the TRAIL level of one higher timeframe. Colour = timeframe, not direction.
- Only timeframes above the chart's own are drawn. On a 4h chart you get 1D and 1W; on 1D you get 1W.
- Price approaching a higher-timeframe level is a moment worth a closer look on that timeframe.
How to switch it on
- 1. Indicators → ELCARO TRAIL → Settings.
- 2. In Higher timeframe levels, turn on Show on the price chart.
- 3. Pick the levels: 1H, 4H, 1D, 1W trail level. By default 4H, 1D and 1W are on.
Good to know
Each level appears if its own timeframe is in your plan. For example, with Basic (1h and 4h) a 1h chart shows the 4H level. The Terminal plan shows all of them.