
18 chart types and 4 price scales
Candles, Heikin Ashi, line, area and more, with regular, percent, indexed and logarithmic scales. Free for every account.
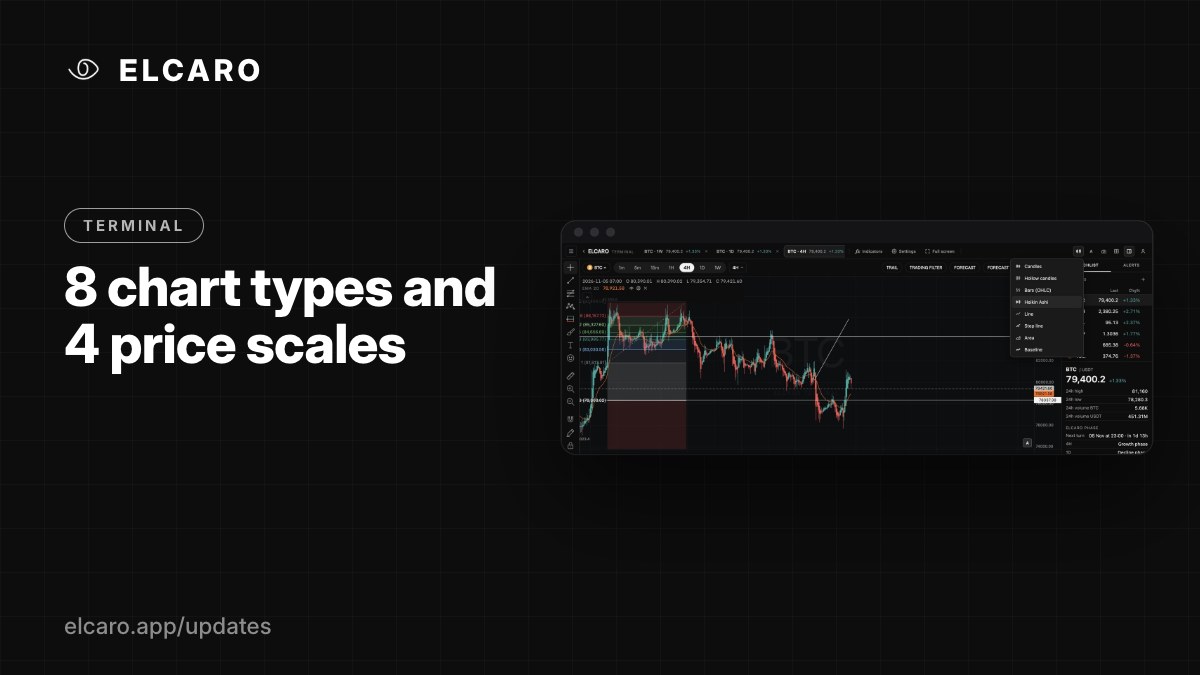
What it gives you
Different views answer different questions. The Terminal lets you change how the price is drawn and how the scale is measured, chart by chart.
Chart types
Candles, Hollow candles, Bars (OHLC), Heikin Ashi, Line, Step line, Area and Baseline. Click the chart-type button in the header to change the focused chart. Set a default in Settings → Symbol.
Heikin Ashi only changes the picture: indicators, the forecast, alerts and drawings still use the real candles.
Price scales
- Regular: plain price.
- Percent: change from the first visible bar, handy for comparing moves.
- Indexed to 100: every chart starts at 100, handy for comparing assets.
- Logarithmic: equal distances for equal percentage moves, useful over long ranges.
- Plus Invert scale.
Use the scale button in the header or Settings → Scales and lines.
Good to know
Settings also cover candle colours, price precision, the time zone, grid, watermark and crosshair style. All of it is saved to your account.