
Timeframes, custom intervals, chart types and scales
The built-in timeframes, how to add custom intervals and favourites, the 18 chart types and 4 price scales, and when to use each.
Timeframes
- Built-in: 1m, 5m, 15m, 1H, 4H, 1D, 1W, in the header.
- A small mark shows which timeframes your plan covers for the ELCARO indicators. Charts work on every timeframe for everyone.
Custom intervals
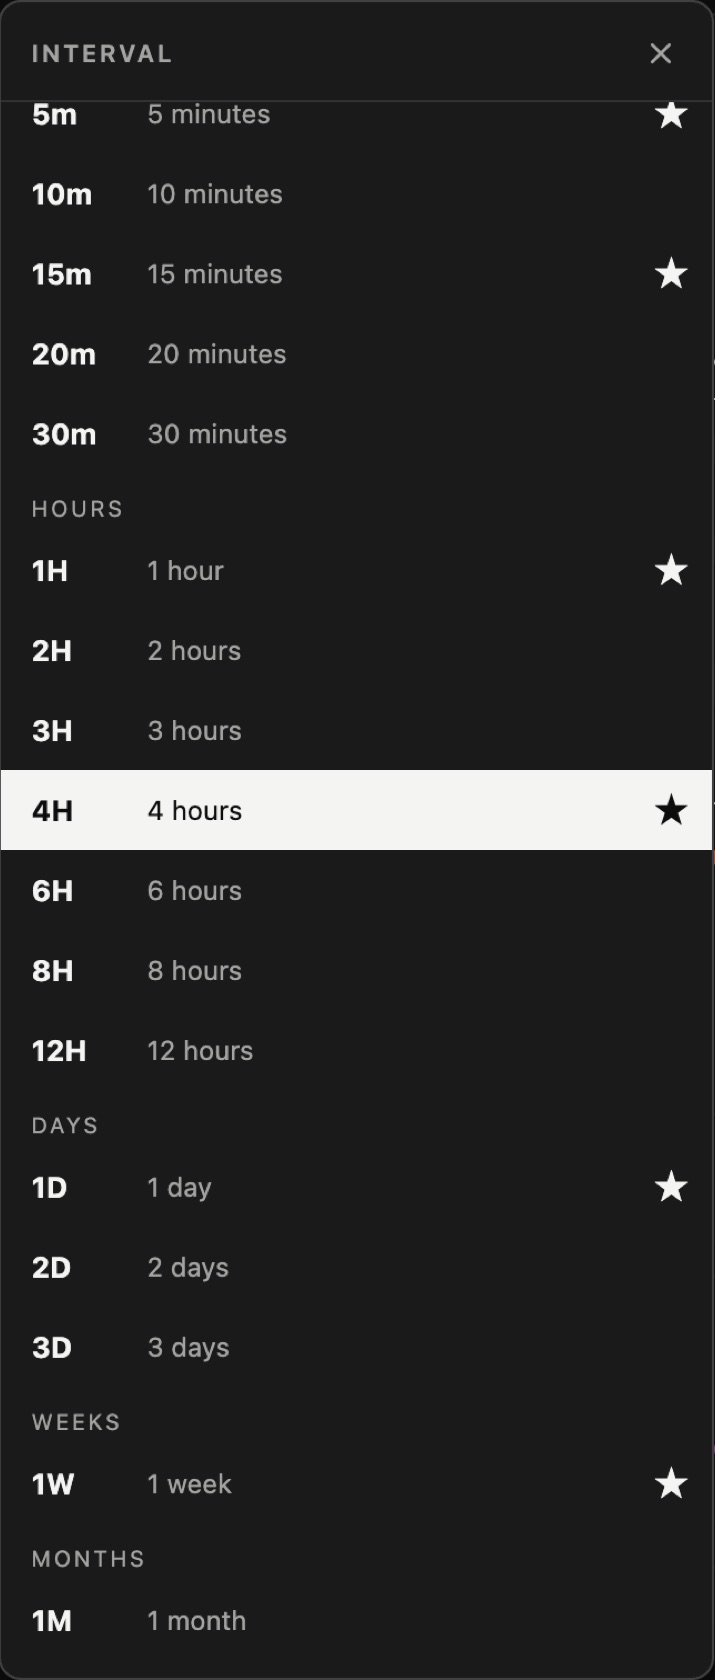
- Step 1. Click + next to the timeframes.
- Step 2. Pick a ready interval: 2m, 3m, 10m, 20m, 30m, 2h, 3h, 6h, 8h, 12h, 2D, 3D or 1M. Or click Add custom interval… and enter your own.
- Step 3. Click the star next to an interval to keep it in the header as a favourite.
Good to know:
- Bars are aligned to UTC, so a 3D bar may start on a different day than on other platforms.
- Some very short intervals are available for crypto only.
- The ELCARO indicators on custom intervals are part of the ELCARO Terminal plan.
Chart types
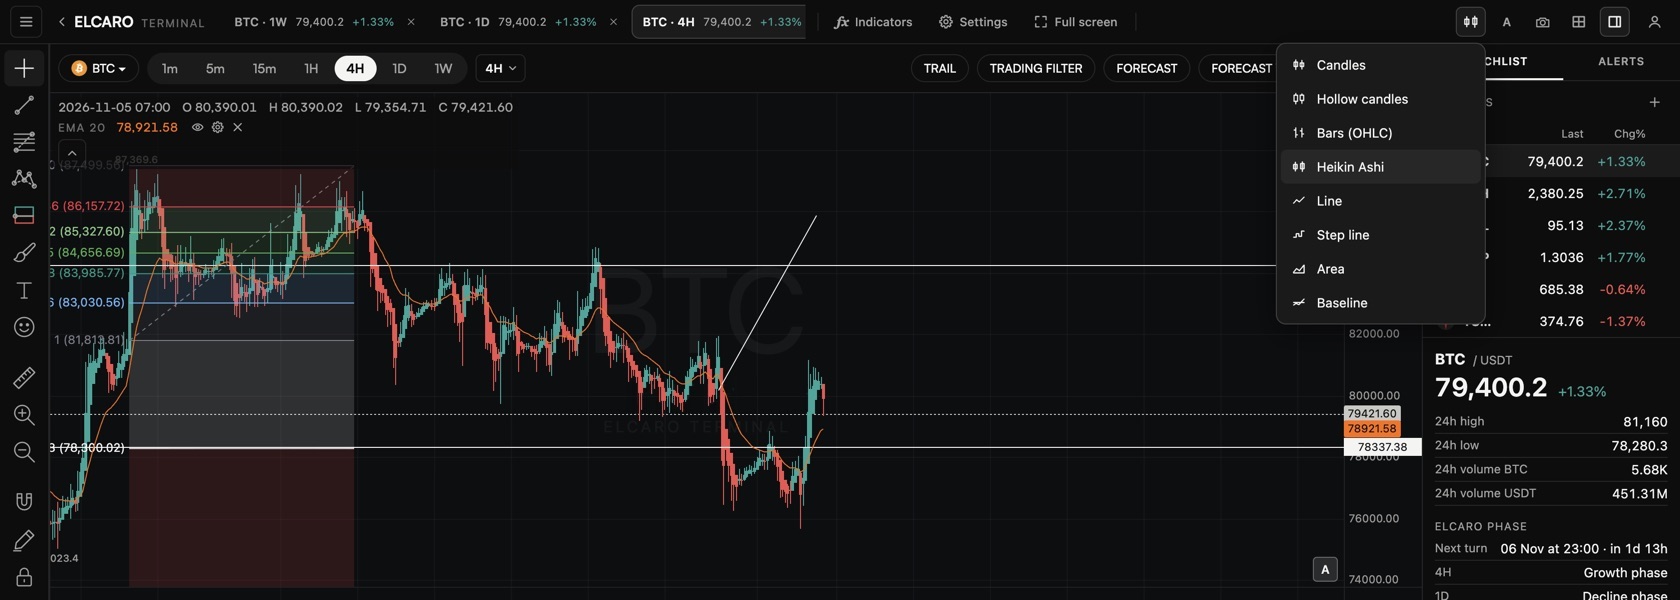
Click the chart type button in the header. 18 types come in three groups, and every new type has a preview card in the menu.
Bars
- Candles and Hollow candles: the classic view.
- Bars (OHLC): open, high, low and close as bars.
- Heikin Ashi: smoothed candles that make trends easier to see. Display only: indicators, the forecast, alerts and drawings still use the real candles.
- High-low: each bar as a line from its low to its high.
- Volume candles: candles that also show how much traded in each bar.
Lines
- Line, Step line, Area and Baseline: a cleaner view of the closing price.
- Columns: the close of each bar as a column.
- Line with markers: the closing line with a dot on every bar.
- HLC area: a band between each bar's high and low, with the close line through it.
Bricks
- Renko, Line break, Range, Kagi and Point & figure: these styles filter out small moves and draw only moves of a set size. Each brick sits at the bar where it formed, so the time axis, the indicators and your drawings stay on the real candles. Point & figure follows the live tick.
- Set them in Settings → Symbol → Bricks: Box size (Auto (ATR), Fixed or Percent, with the ATR length), Reversal (boxes) for Point & figure, and Lines for Line break.
To make one type the default for new charts: Settings → Symbol → Default chart type.
Themes and accent
- Click Settings and open the Canvas section.
- Pick a theme: Auto (app theme), Noir, Graphite, Navy, OLED, Light or Paper. The header, the chart, the panels and your snapshots follow it.
- Pick an accent: None, Orange, Blue, Green, Violet or White. It colours the active tabs, buttons and menu items. Colours of price direction stay as they are.
Price scales
Click the scale button in the header, or Settings → Scales and lines → Scale type:
- Regular: price as is.
- Percent: change from the first visible bar in percent.
- Indexed to 100: compare assets from a common start.
- Logarithmic: for long histories with big moves.
- Invert scale: flips the chart upside down.
In the news: chart types and scales · custom timeframes
Read next
Layouts, tabs and sync
How to put up to 4 charts in a tab, sync them, use up to 12 tabs, resize charts, take snapshots and change the Terminal settings.
Terminal plans and access
What every account gets, what the 14-day free window opens, what each app plan opens in the Terminal and what the ELCARO Terminal plan adds.