
Layouts, tabs and sync
How to put up to 4 charts in a tab, sync them, use up to 12 tabs, resize charts, take snapshots and change the Terminal settings.
Several charts in one tab
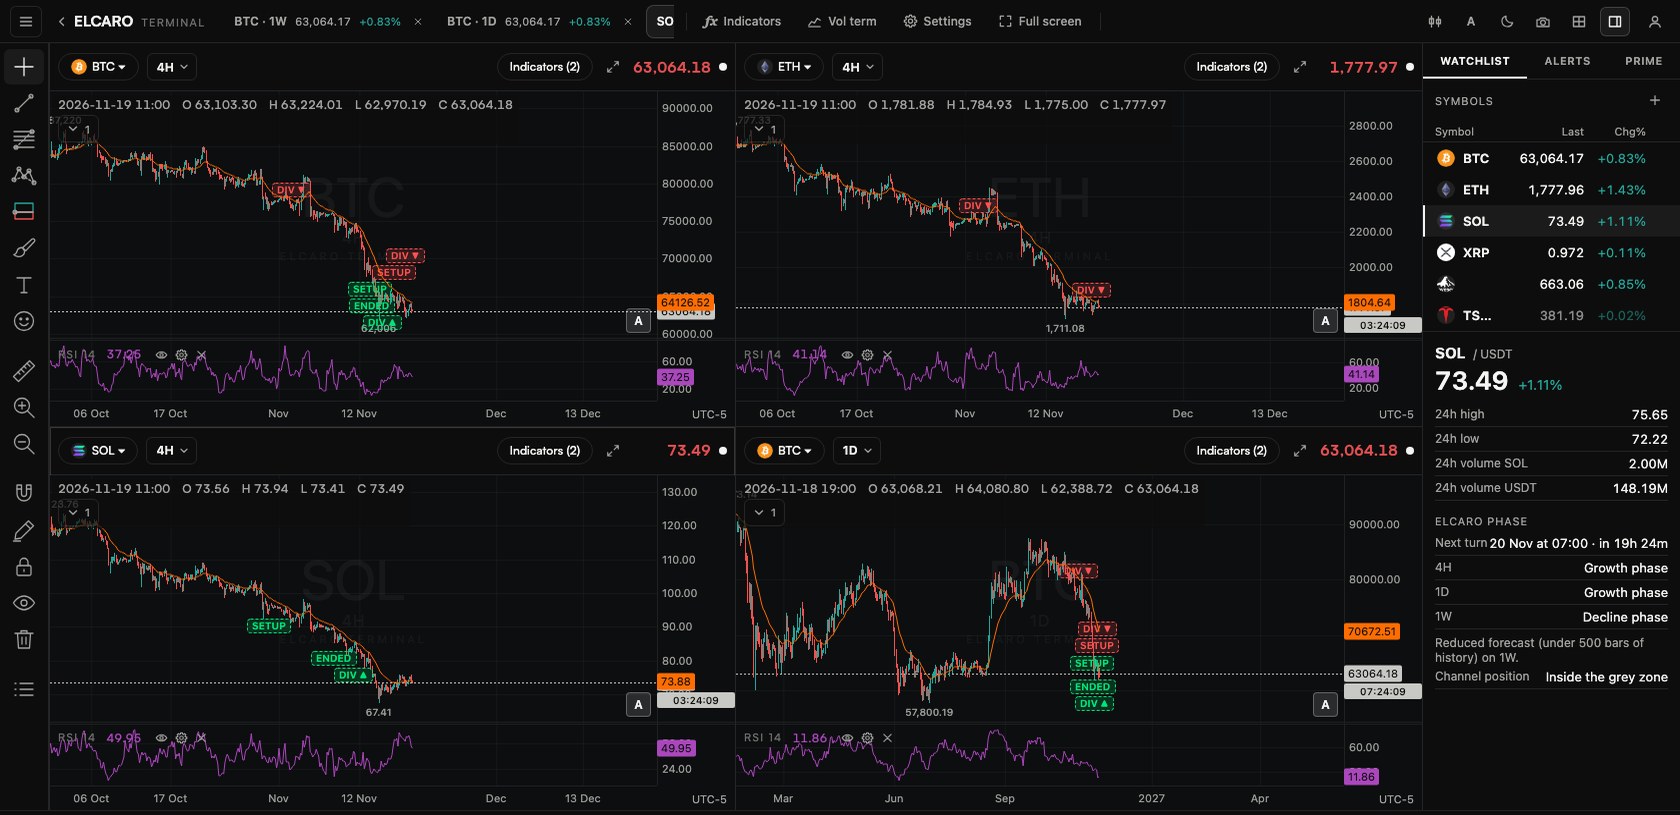
- Step 1. Click Layout and sync in the header.
- Step 2. Pick a layout: single chart, 2 columns, 2 rows, 3 columns, 3 rows, 1 + 2, 2 + 1, 1 over 2, 2 over 1, or 4 charts.
- Step 3. Click a chart to make it active. The header (asset, timeframe, indicators) works on the active chart.
- Step 4. Drag the dividers between charts to resize them. Double-click a divider to make them equal again.
Focus on one pane
- A pane: double-click the price chart, the trading filter or a standard indicator pane to make it fill the whole chart. Double-click again, or press
Esc, to bring the previous heights back. - A whole chart: in a layout of 2 to 4 charts, hold
Shiftand double-click a chart, or use the button in the header, to make it fill the workspace. Repeat, or pressEsc, to return to your layout. - While the trading filter or an indicator is expanded, the price chart labels are hidden so the view stays clean.
- Axes, drawing tools and the text of a drawing keep their own double-click.
Sync
In Layout and sync, choose what the charts in this tab share:
- Symbol: change the asset on one chart and the others follow.
- Interval: the same timeframe on all charts.
- Crosshair: the crosshair moves on all charts together. On by default.
- Time: scrolling one chart scrolls the others.
- Date range: all charts show the same period.
A common setup: sync the symbol and crosshair, and give each chart a different timeframe.
Tabs
- Add a tab next to the existing ones. Up to 12.
- Each tab keeps its own layout, charts, indicators and sync.
- Use tabs for groups of assets or for different ways of looking at one asset.
Snapshots
- Click the camera button.
- Download image or Copy image of the active chart.
- In a layout with several charts, also Download whole layout or Copy whole layout.
- Shortcut:
Alt+S. - Snapshots follow your theme.
Settings
Click Settings in the header. The main sections:
- Symbol: the default chart type, the brick settings, the time zone and more.
- Status line: what the line at the top of the chart shows (values, indicator values).
- Scales and lines: the price scale type, precision, date and time format.
- Canvas: the theme and accent, candle colours, background, grid, watermark, crosshair and order flow on the chart.
- Alerts: sound and browser notifications.
Keyboard shortcuts
Cmd/Ctrl+Ksearch an assetAlt+Ttrend line,Alt+Hhorizontal line,Alt+Jhorizontal rayAlt+Vvertical line,Alt+Ccross line,Alt+FFib retracementAlt+Aadd an alert,Alt+Ssave the chart imageCmd/Ctrl+Zundo,Cmd/Ctrl+Shift+ZorCmd/Ctrl+YredoDeleteremove the selected drawing,Esccancel, deselect or bring back an expanded pane?the full list of shortcuts
Saving
Everything saves to your account automatically: tabs, layouts, sync, the watchlist, panels, indicators, favourite timeframes and settings. Sign in on another device and your workspace is there.
In the news: layouts and tabs
Read next
Getting started with ELCARO Terminal
What the Terminal is, how to open it on any device, a tour of the screen and your first ten minutes, step by step.
Timeframes, custom intervals, chart types and scales
The built-in timeframes, how to add custom intervals and favourites, the 18 chart types and 4 price scales, and when to use each.
Drawing tools
How the drawing toolbar works: picking a tool, placing points, selecting and styling a drawing, the magnet, drawing mode, locking, hiding and removing, undo, saving and the phone.