
Drawing tools
How the drawing toolbar works: picking a tool, placing points, selecting and styling a drawing, the magnet, drawing mode, locking, hiding and removing, undo, saving and the phone.
Free for every account. Every drawing tool works on any chart, on any asset and any timeframe, with no plan.
The drawing toolbar runs down the left edge of the chart. Every signed-in account has every drawing tool and the icon palette. Drawings are your own marks; they never change the ELCARO indicators.
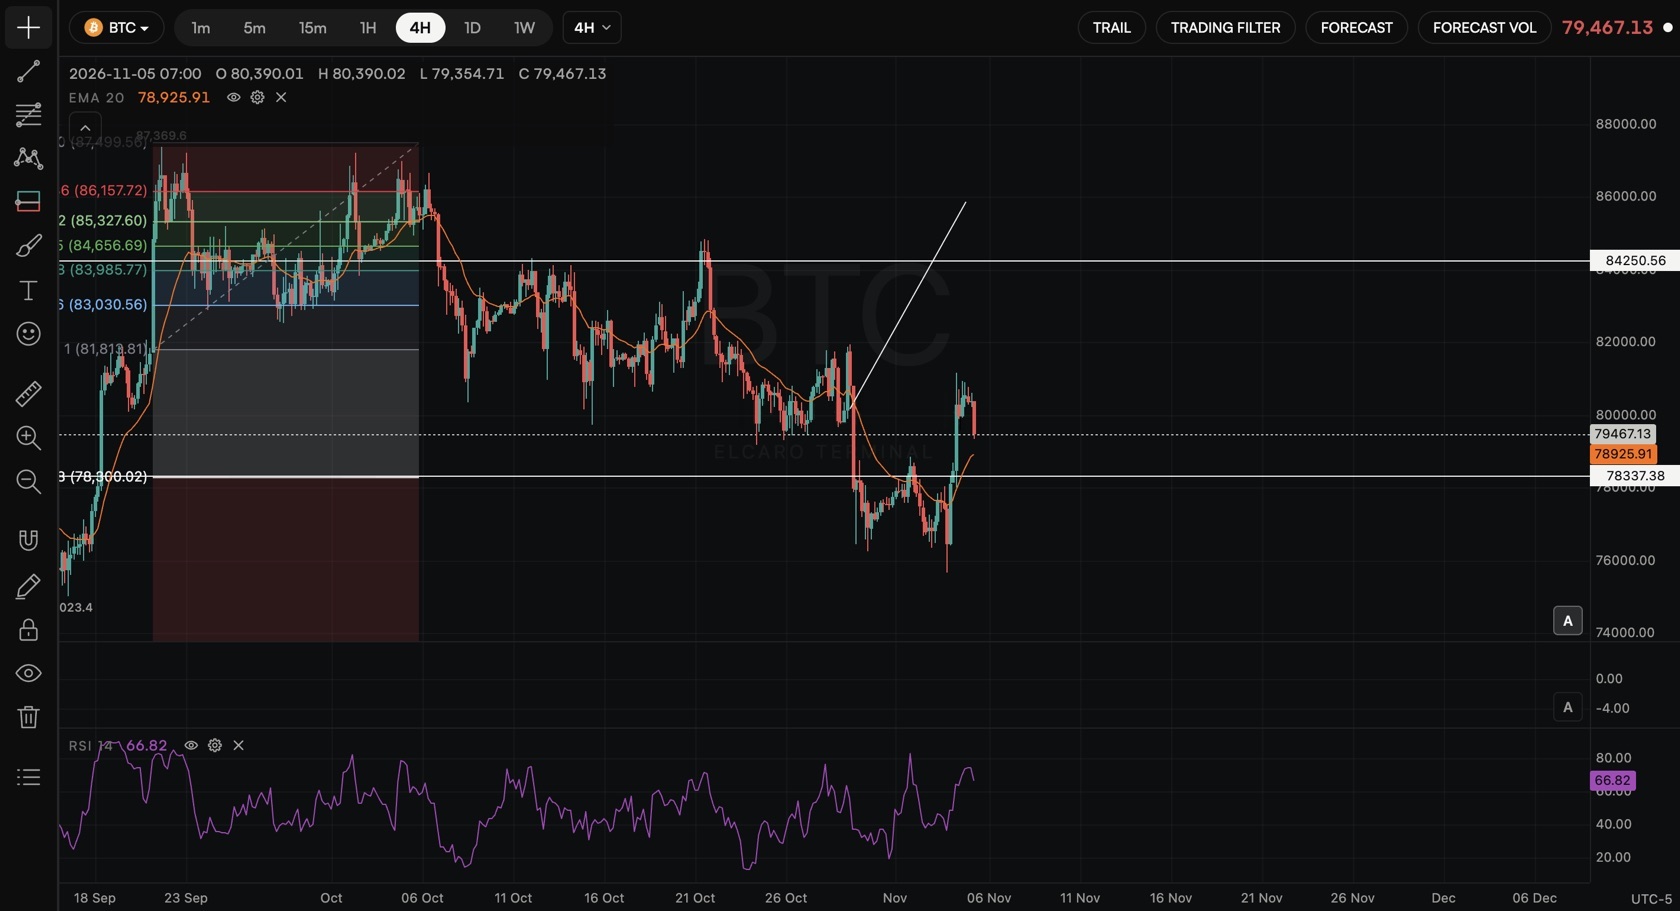
The toolbar
- The menu button (three lines) at the left of the header shows and hides the toolbar.
- Each button is a group: Cursors, Trend line tools, Gann and Fibonacci tools, Patterns, Forecasting and measurement tools, Geometric shapes, Annotation tools and Icons. Point at a button to see its name.
- A group button shows the tool you used last in that group. Click it to pick that tool again.
- To see the whole group, point at the button and click the small arrow on its right edge. Tools with a hotkey show it in the list.
- Click the active tool again to switch it off.
Draw
- 1. Pick a tool.
- 2. Click the chart once for every point the tool needs. A horizontal line takes one click, a trend line two, a pattern four or more. Each topic article gives the count.
- 3. After the last point the drawing is finished and selected.
- 4. Press
Escto cancel a drawing halfway.
Points can sit right of the last candle, in the empty area. Path and Polyline take any number of points: finish them with a double-click, Enter or a right-click.
Hold Alt (Windows) or ⌥ / ⌘ (Mac) while you place or drag a point to switch the magnet off for that move.
Select and edit
- Click a drawing to select it. Only the selected drawing shows its frame and handles, so the rest of the chart stays clean.
- Drag a handle to reshape it, or drag the drawing to move it. A rectangle has a handle on each of its 4 corners and 4 edges, with a generous grab area.
- Double-click a drawing to type text on it, or to edit the text it already has. A selected rectangle shows + Add text in its centre: click it to start typing.
Entersaves,Shift+Enteradds a line,Esccancels. - Click an empty spot of the chart or press
Escto deselect.
A style bar appears at the top of the chart while a drawing is selected:
- Drawn and the date and time it was made.
- Eight colours, three line widths, Solid and Dashed.
- A padlock: Lock or Unlock. A locked drawing cannot be moved or reshaped.
- Alert on trend lines, rays, extended lines, horizontal lines and rays; Alert at this time on a vertical line.
- Delete.
The buttons under the groups
- Measure: picks the date and price range tool. See Measuring tools.
- Zoom in and Zoom out.
- Magnet: a click turns on the weak magnet. The small arrow offers Weak magnet, Strong magnet and Magnet off. Weak pulls a point to a candle's open, high, low or close when you click close to it; strong always does. The magnet also helps you land on the corners and edges of a rectangle. Hold
Alt(Windows) or⌥/⌘(Mac) to switch it off while you draw or drag a point. - Stay in drawing mode: the tool stays picked after each drawing, so you can draw several in a row. The setting is remembered on this device.
- Lock all drawings and Unlock all drawings.
- Hide all drawings and Show all drawings. This hides drawings only.
- Remove: the small arrow offers Remove selected drawing (
Del) and Remove all drawings. - Drawings list: every drawing on the chart, newest first, with the time it was made. Click one to select it and bring it to the middle of the chart.
The Eraser cursor in the Cursors group deletes any drawing you click.
Undo and redo
⌘Z (Mac) or Ctrl+Z (Windows) undoes; ⌘⇧Z or ⌘Y (Ctrl+Shift+Z or Ctrl+Y) redoes. The Terminal keeps the last 100 steps: new drawings, moves, style changes, locks and removals. The history starts fresh when you switch asset.
Saving and limits
- Drawings save to your account by themselves, per asset and per chart. Each chart of a layout keeps its own drawings for each asset.
- A drawing is stored at its dates and prices, so it stays in place when you change the timeframe.
- Up to 300 drawings per asset and 3,000 in total.
Phone and tablet
- On a phone the toolbar starts folded. Tap the menu button to open it; the Terminal remembers your choice.
- Tap to place each point. For a two-point tool you can also press, drag and lift.
- Tap a drawing to select it, then drag it. Double-tap text to edit it.
- Two fingers still move and zoom the chart.
In the news: drawing tools · guide drawing tools digest
Read next
Lines and line alerts
Trend line, ray, info line, extended line, trend angle, horizontal and vertical lines, cross line, and how to set an alert from a line you drew.
Brushes, arrows, shapes, text and icons
Freehand brushes, the four arrows, ten shapes, ten text and note tools and the icon palette: how to place each one and edit its text.
Keyboard shortcuts
Every drawing and chart hotkey in the Terminal, with the Mac key and its Windows equivalent, and how to open the list.
Layouts, tabs and sync
How to put up to 4 charts in a tab, sync them, use up to 12 tabs, resize charts, take snapshots and change the Terminal settings.