
All updates
 Full guide ELCARO Options: Δ0.1 levels, σ boxes and Expected Move
Options November 6, 2026
Δ0.1 levels: the market's 10% lines
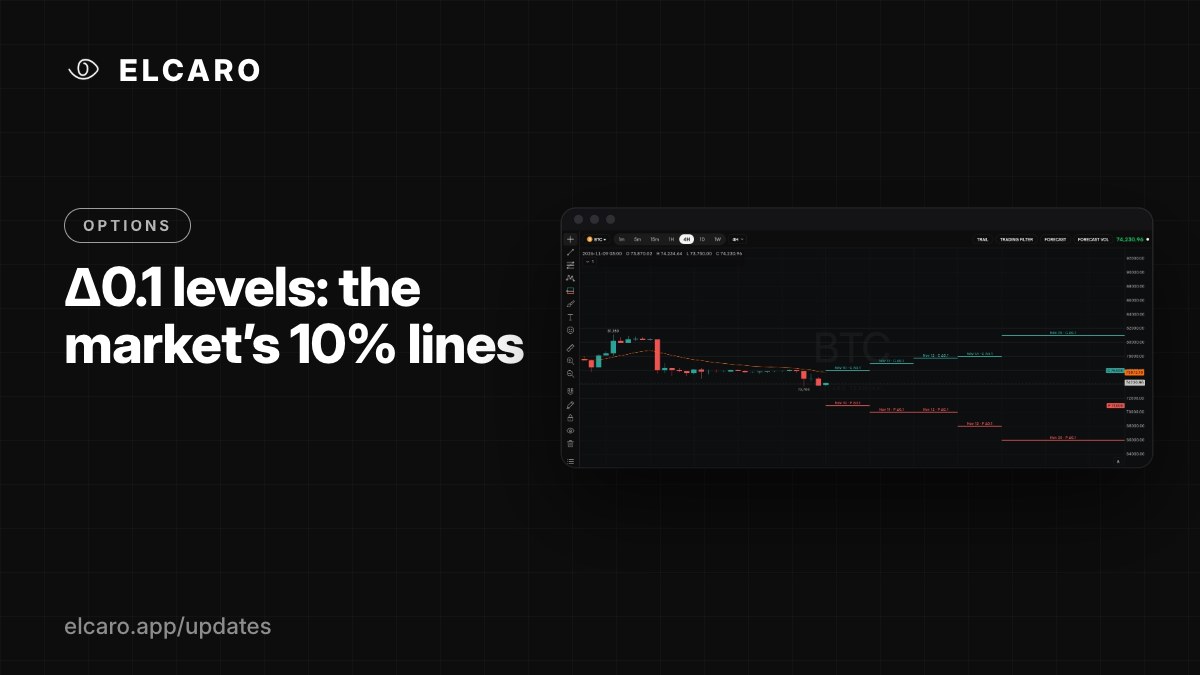
Two lines per expiry: above, where calls price about a 10% chance of reaching; below, the same for puts. They move live.
What it gives you
An option's delta roughly equals the chance the market gives the price of reaching that strike by expiry. Δ0.1 levels draw the strikes with about a 10% chance, up and down, so you see the range the market treats as unlikely but possible.
What you see
- For each expiry, a growth-colour line labelled C Δ0.1 above the price and a decline-colour line labelled P Δ0.1 below it.
- Each line runs from the previous expiry to its own. Future expiries are drawn to the right of the last candle.
- The lines move live with the market.
- Hover a line for the expiry, time left, strike, the chance of reaching it, mark price and implied volatility.
How to switch it on
Indicators → ELCARO Options → Δ0.1 levels.
Settings
- Expiries: Daily (up to 14 days ahead, the default), Weekly, Monthly or All.
- Opacity.
Good to know
The full table of expiries, strikes and ranges is one click away: Settings → Options table and expected move.