
ELCARO Options: Δ0.1 levels, σ boxes and Expected Move
What the options market implies for an asset, drawn on its chart: how to switch on each layer, read it, choose expiries and open the options table.
ELCARO Options reads live options prices and draws what the options market implies on your chart. These are market-implied values, not a forecast.
Assets: BTC, ETH, SOL, XRP, DOGE, MNT, HYPE, XAUT, NVDA, TSLA, QQQ, SPCX, SNDK, SKHY, MU and SOXL, on any chart of the same asset. On other assets the rows are greyed out. Only current and future expiries are drawn. Access follows your plan.
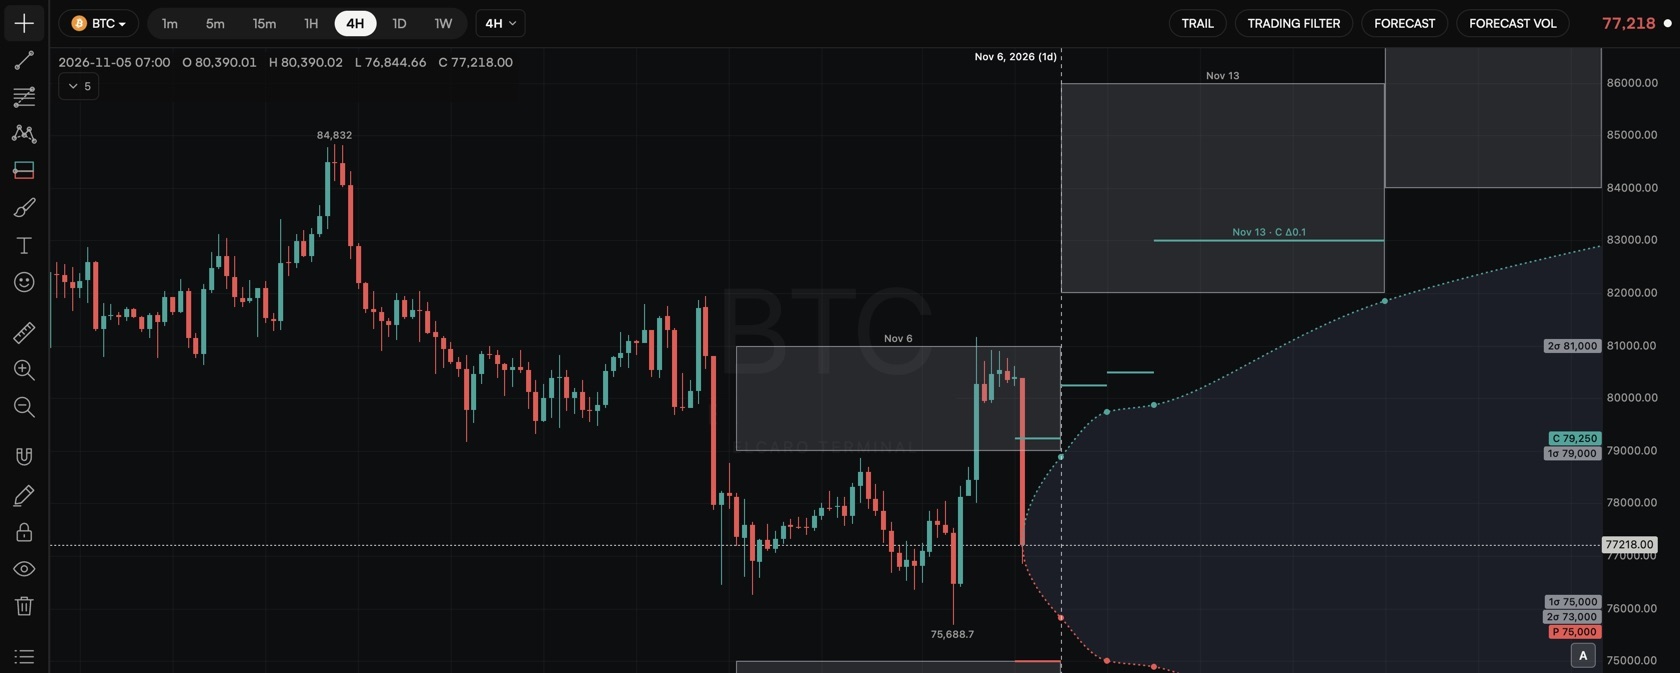
Switch a layer on
- Step 1. Open an asset from the list above.
- Step 2. Open Indicators and find the ELCARO Options block.
- Step 3. Turn on Δ0.1 levels, Straddle σ boxes or Expected Move. Each is off by default.
- Step 4. Click Settings on the row to choose expiries and opacity.
Δ0.1 levels
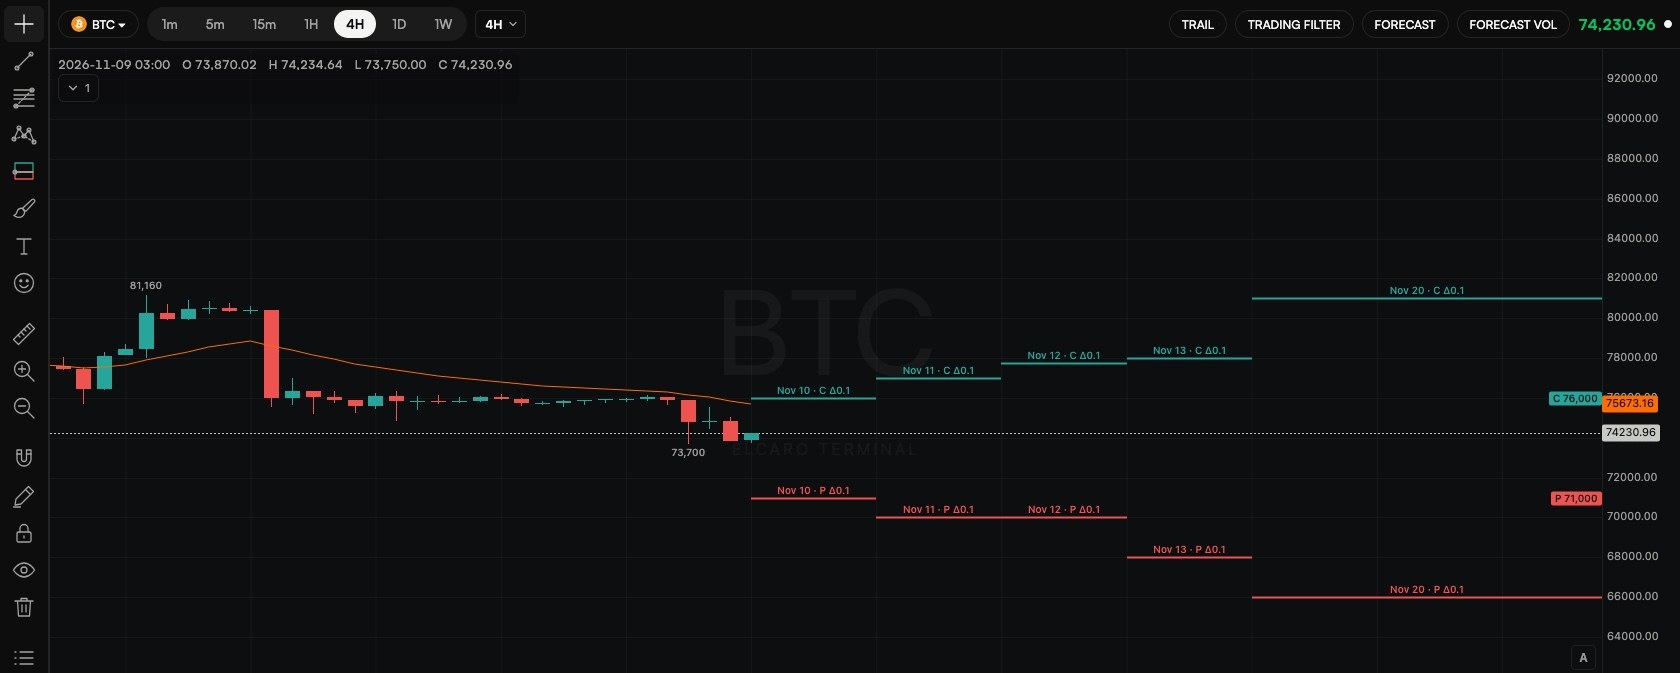
- What you see: for each expiry, a line above the price labelled C Δ0.1 and a line below labelled P Δ0.1.
- What it means: the options market gives about a 10% chance that the price reaches that line by that expiry. Up through the upper line, down through the lower one.
- Each line runs from the previous expiry to its own. Future expiries are drawn to the right of the last candle. The lines move live.
- Hover a line for the expiry, the time left, the strike and its chance, the option's price and implied volatility.
- Expiries: Daily (up to 14 days ahead, the default), Weekly, Monthly or All.
Straddle σ boxes
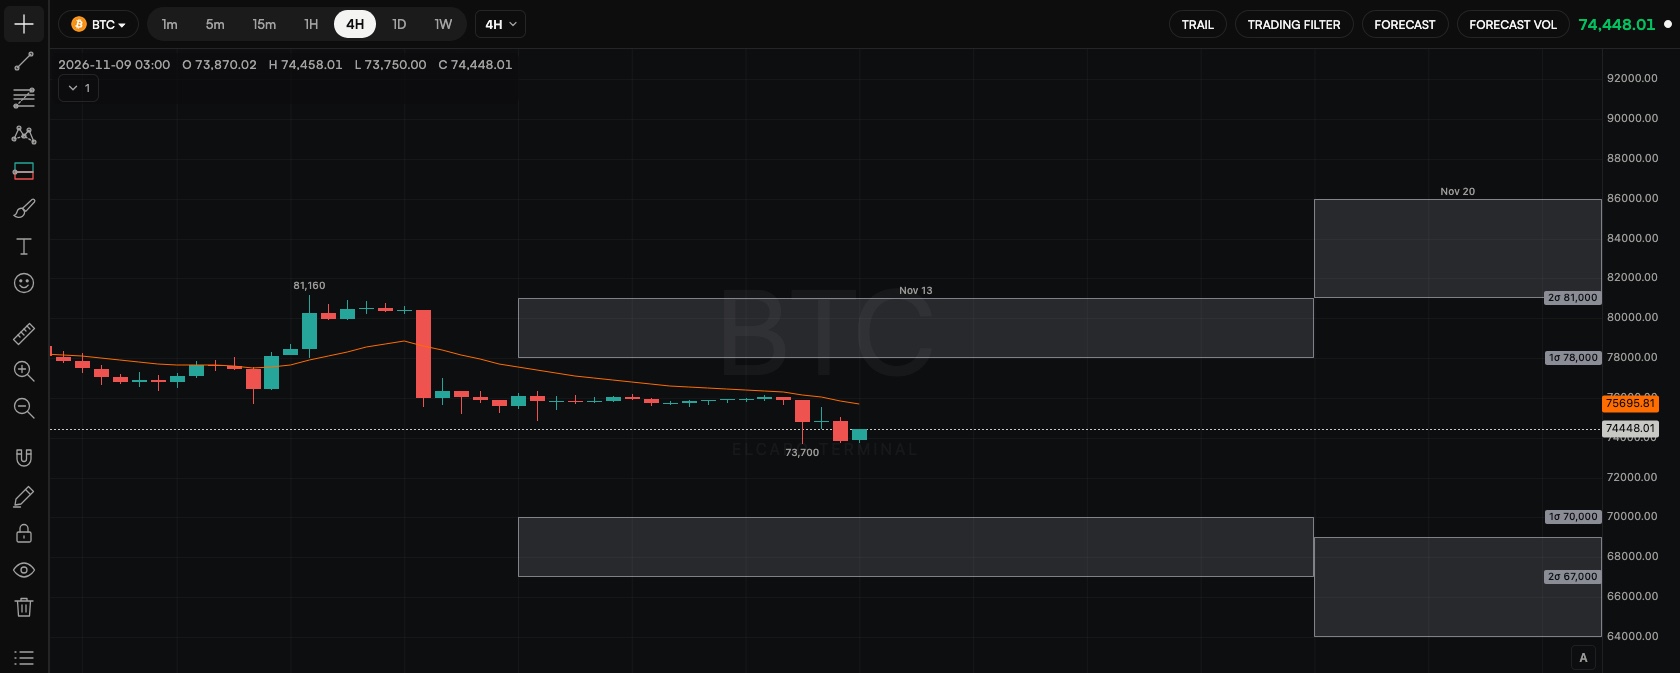
- What you see: for each expiry, grey boxes between +1σ and +2σ above the price and between −1σ and −2σ below it.
- What it means: the range the options market implies by that expiry. About 68% of the time the price stays inside 1σ and about 95% of the time inside 2σ.
- σ comes from the price of the at-the-money straddle. Levels are rounded to the asset's strike step (BTC to 1,000, ETH to 100, stocks to whole dollars).
- Settings: Expiries (Weekly by default, i.e. Fridays), Break-even lines (dashed lines at the straddle's break-even prices), Third zone (3σ, 99.7%), Opacity.
Expected Move
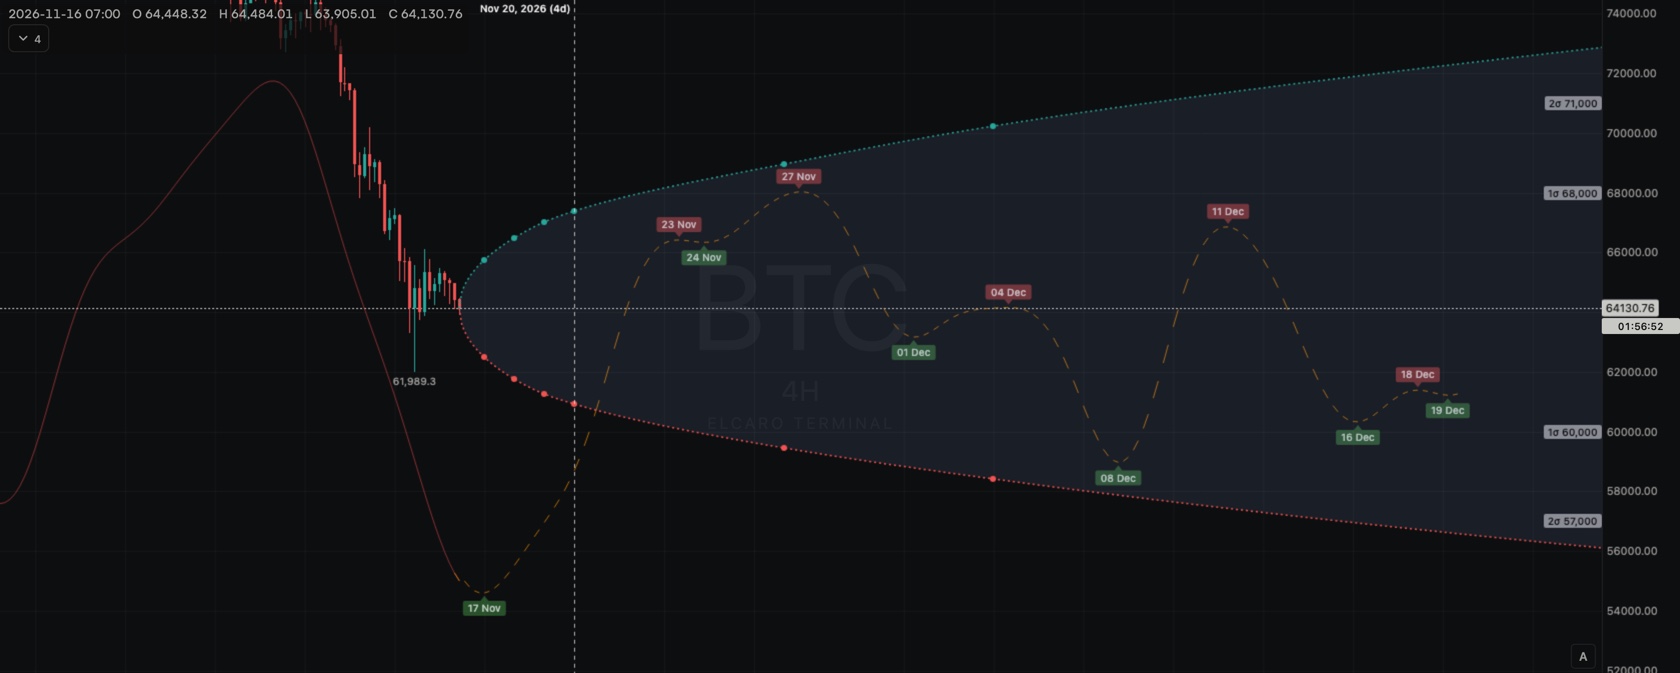
- What you see: a cone to the right of the last candle, with a dot above and below at every listed expiry.
- What it means: the 1σ range (about 68%) the options market implies for each expiry.
- Hover an expiry for the expected move in dollars and percent, the implied volatility and the upper and lower prices.
The options table
- Step 1. Open Settings on any ELCARO Options row.
- Step 2. Click Options table and expected move.
- Step 3. The table lists every expiry: time left, the underlying price, the at-the-money strike, the straddle, implied volatility, break-even, the 1σ and 2σ ranges and both Δ0.1 levels. Below it, pick any expiry date to see its expected move.
In the news: elcaro options · delta levels · straddle sigma boxes · expected move · guide options order flow
Read next
The options data panel
Call and put volume, open interest by strike, the put/call ratio, implied volatility and recent options trades in one panel: how to open, dock and read it.
Terminal plans and access
What every account gets, what the 14-day free window opens, what each app plan opens in the Terminal and what the ELCARO Terminal plan adds.