
All articles
ELCARO Terminal
The options data panel
Call and put volume, open interest by strike, the put/call ratio, implied volatility and recent options trades in one panel: how to open, dock and read it.
The options data panel gathers what the options market is doing on an asset in one place.
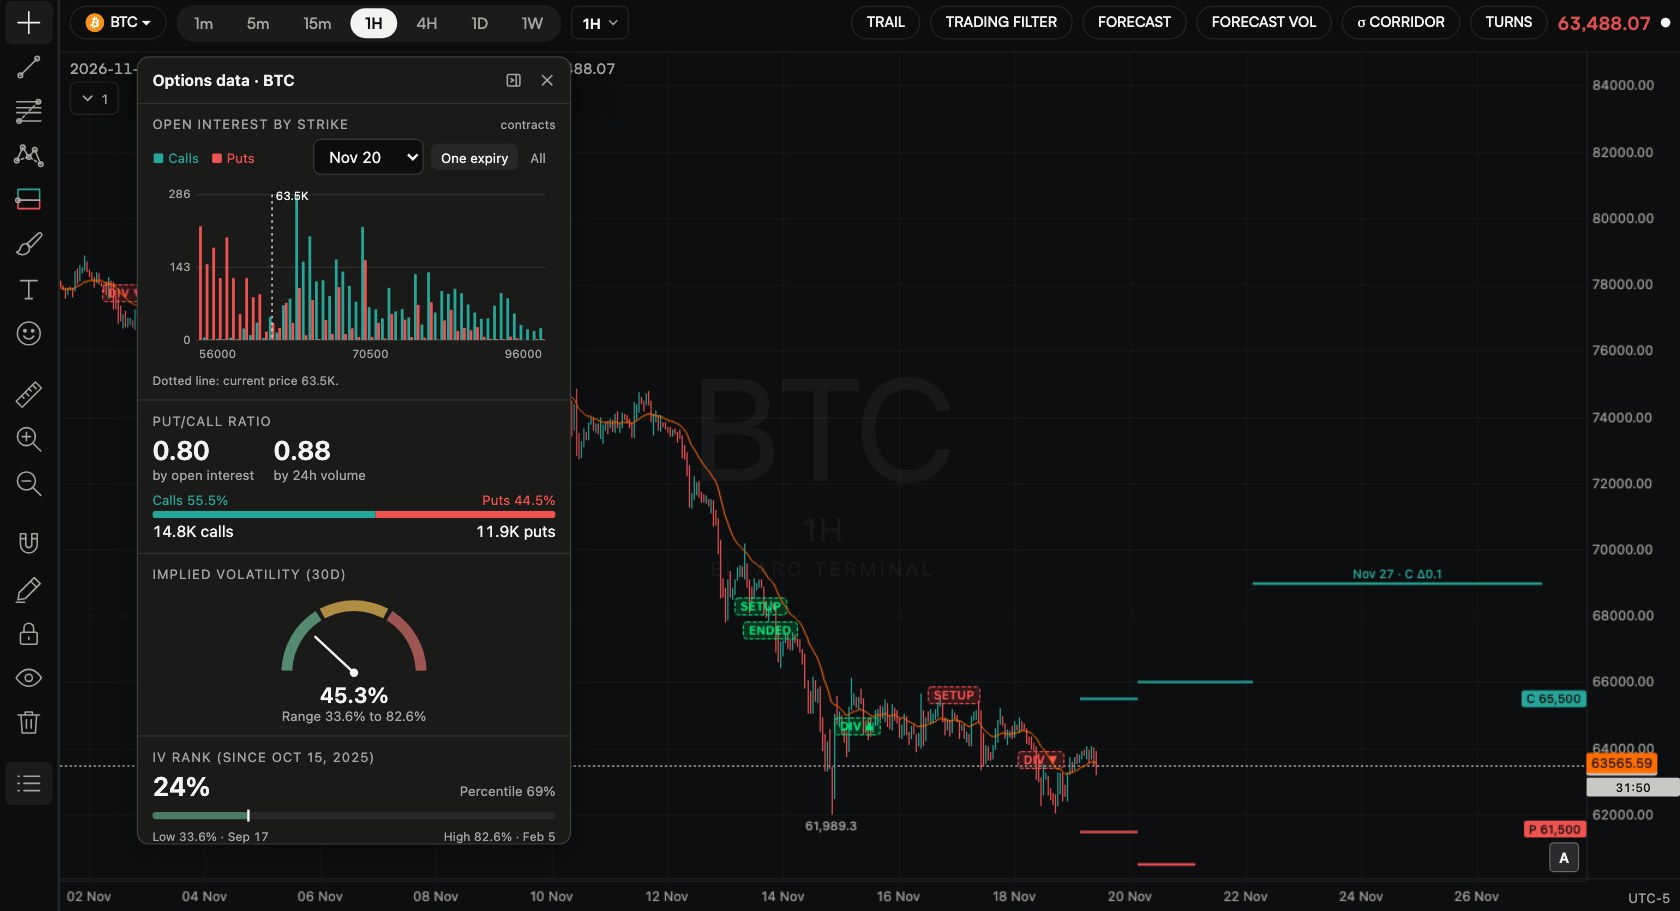
Open and dock it
- Step 1. Open an asset with options (see ELCARO Options for the list).
- Step 2. Indicators → ELCARO Options → turn on Options data. A floating panel opens over the chart.
- Step 3. To keep it out of the way, dock it: it becomes the OPTIONS tab in the right panel. You can undock it again at any time.
What is inside
- Volume: call and put volume over 24 hours, with their shares.
- Open interest by strike: calls and puts at each strike, for one expiry or all. A dotted line marks the current price.
- Put/call ratio: by open interest and by 24h volume.
- Open interest: the total, its average and range, and the top 5 expiries.
- Implied volatility: the 30-day level, IV rank and percentile, implied volatility by strike (the smile), the term structure by expiry and a short history.
- Recent trades: the latest options trades with their value in dollars.
How to read it
- Large open interest at a strike shows where many options sit.
- A put/call ratio above 1 means more puts than calls; below 1, more calls.
- Higher implied volatility means the options market expects bigger moves.
Settings
- The sections to show: Volume, Open interest, Implied volatility, Recent trades.
- IV smile opens on: Nearest or Weekly expiry.
- Smallest trade: All, $100, $1,000 or $10,000.
Figures based on history need a few weeks of stored data on some assets and say so until then.
In the news: options data panel
Read next
ELCARO Options: Δ0.1 levels, σ boxes and Expected Move
What the options market implies for an asset, drawn on its chart: how to switch on each layer, read it, choose expiries and open the options table.
Order flow: liquidations, large trades and money flow
How to switch on and read liquidation bubbles, the large trades panel and money flow by trade size, with their settings and limits.