
All updates
 Full guide Awesome Oscillator (AO)
Free indicator November 6, 2026
Awesome Oscillator: quick versus slow midpoints
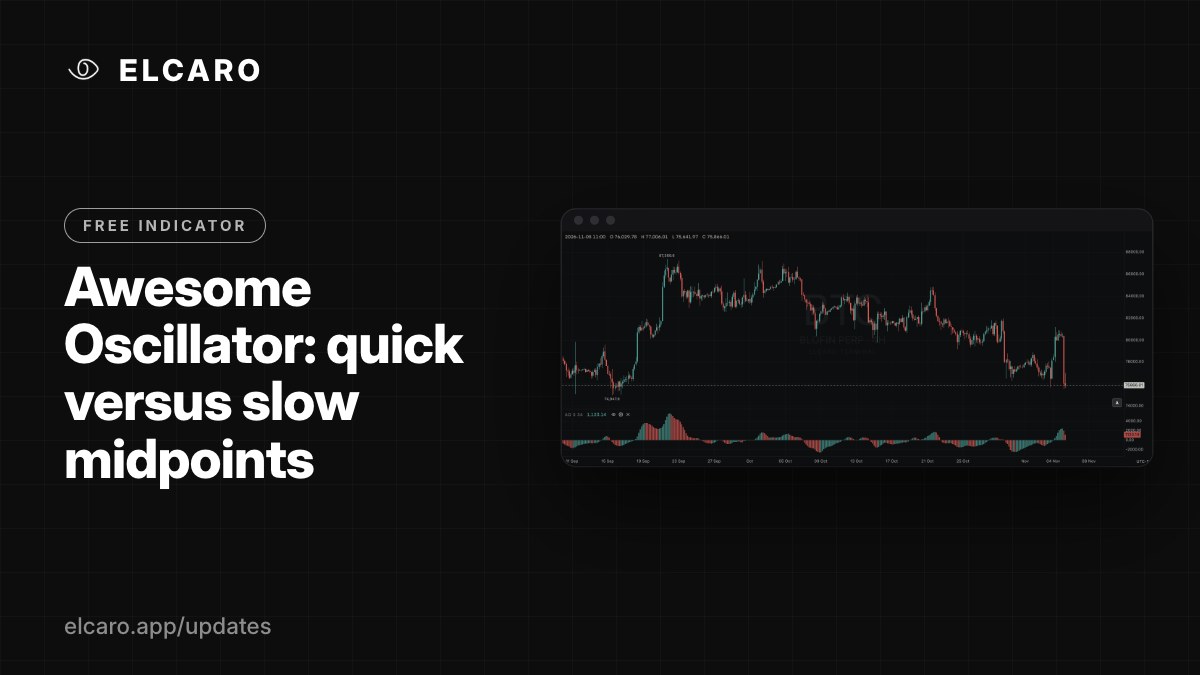
Bars around zero for the gap between a quick and a slow average of bar midpoints, coloured by whether the gap grew.
Free for every account. No plan needed: add it to any chart, on any asset and any timeframe.
What it shows
The Awesome Oscillator takes the midpoint of each bar (the average of high and low) and compares a quick 5-bar average of it with a slow 34-bar average. The difference is drawn as bars around zero in its own pane. A bar is teal when it is higher than the bar before and red when it is lower. Free for every account.
How to read it
- Bars above zero: the quick average of midpoints is above the slow one. Below zero: under it.
- The colour shows only the change from the previous bar. A red bar above zero means the gap is shrinking.
- AO crossing zero marks the two averages crossing.
- Two peaks on the same side of zero, the second one smaller, show the move losing speed.
Where to find it
- On the chart: Indicators (fx) → search
AO→ Awesome Oscillator. A legend rowAO 5 34appears in the top-left corner. - Full manual: Help → ELCARO Terminal → "Awesome Oscillator (AO)", with the settings and their defaults, and how to read it next to the ELCARO indicators.