
KDJ
KDJ in its own pane: a stochastic oscillator with K, D and an extra J line, showing where the close sits in the recent range.
Free for every account. No plan needed: add it to any chart, on any asset and any timeframe.
What it shows
KDJ is a stochastic oscillator. It first measures where the close sits inside the high-low range of the last bars, from 0 at the low to 100 at the high. K smooths that reading, D smooths K once more, and J stretches the gap between them.
RSV = (close − lowest low) / (highest high − lowest low) × 100 over the period
K = smoothed RSV; D = smoothed K; J = 3 × K − 2 × D
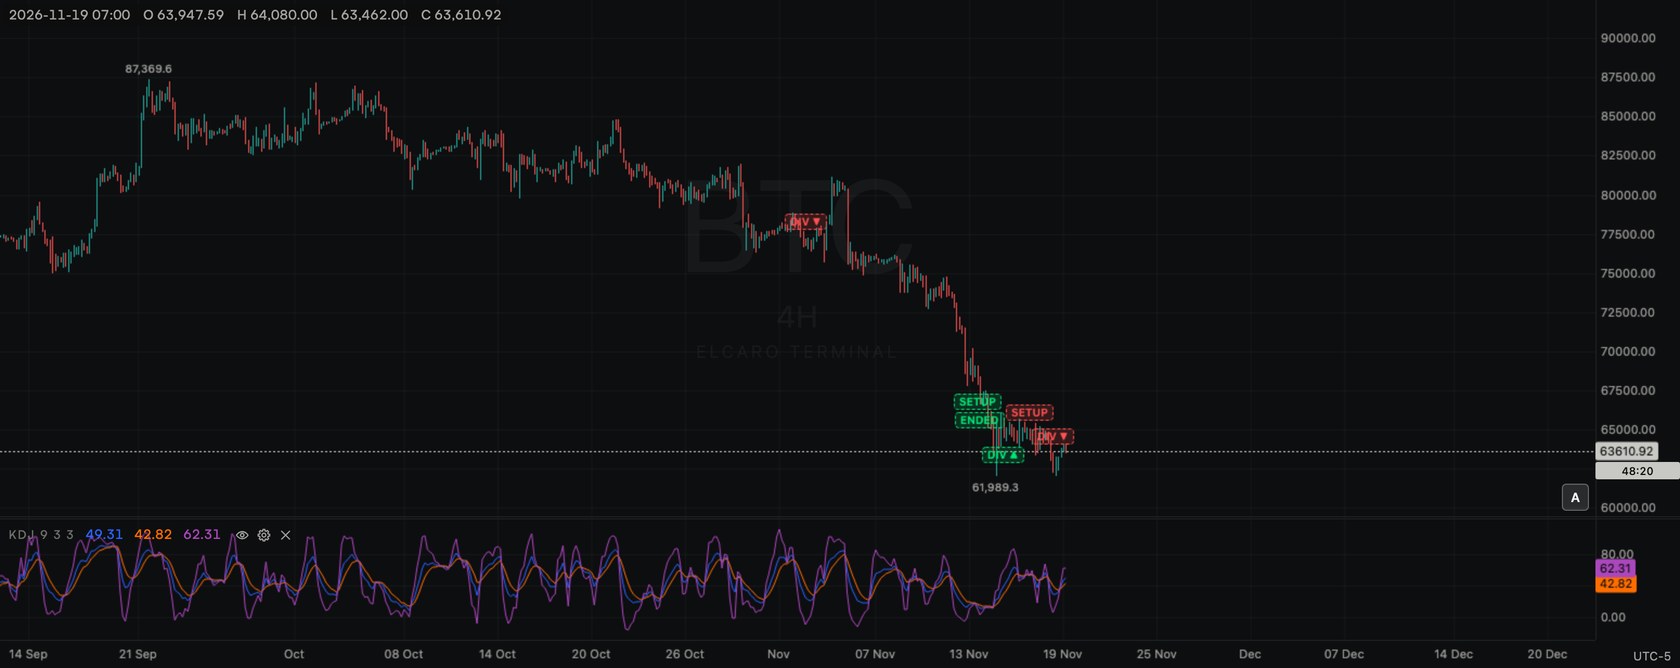
Add it to the chart
- 1. Click Indicators (fx) in the chart header.
- 2. Type
KDJin the search box, or find it under Sub pane. - 3. Click KDJ. A new pane opens under the price chart, with a legend row
KDJ 9 3 3. - 4. Click the gear on the legend row to change it.
Settings
- Period: default 9, range 1–500. The range is taken over these bars.
- K smoothing: default 3, range 1–500.
- D smoothing: default 3, range 1–500.
- K: blue. D: orange. J: purple. Each 1 px wide (1–5 px).
- Visible, Decimals (Automatic shows 2, or a fixed number) and Reset to defaults.
- Pane height: drag the top edge of the pane; double-click it for the default height.
How to read it
- K and D near 100 show closes near the top of the recent range; near 0, near the bottom.
- K crossing D shows the quicker line turning against the slower one.
- J moves furthest and can go above 100 or below 0, which shows a strong stretch.
- In a steady move K and D can stay near an extreme for many bars.
- Price making a new high while K makes a lower high (or the reverse at lows) is a divergence.
Use it with ELCARO
- Compare KDJ extremes with the ELCARO filter (VOL) pane leaving its bands.
- Look at where K and D sit around the forecast's turning dates.
Good to know
- Uses only prices, so it works on every asset.
- One per chart. Takes one of the 4 indicator panes per chart.
- Counts toward the 10 per chart and toward the free limit of 2 standard indicators at a time, also while hidden.
In the news: indicator kdj
Read next
Relative Strength Index (RSI)
RSI in its own pane: a 0 to 100 oscillator comparing the size of rises and falls of the close over the period.
Williams %R (WR)
Williams %R in its own pane: where the close sits in the high-low range of the period, on a scale from -100 to 0.
Commodity Channel Index (CCI)
CCI in its own pane: how far the typical price sits from its average, scaled by its usual deviation.
Standard indicators
The 28 classic indicators of the Terminal, the two groups, how to add, set up, hide and remove one, and how many fit on a chart.