
Standard indicators
The 28 classic indicators of the Terminal, the two groups, how to add, set up, hide and remove one, and how many fit on a chart.
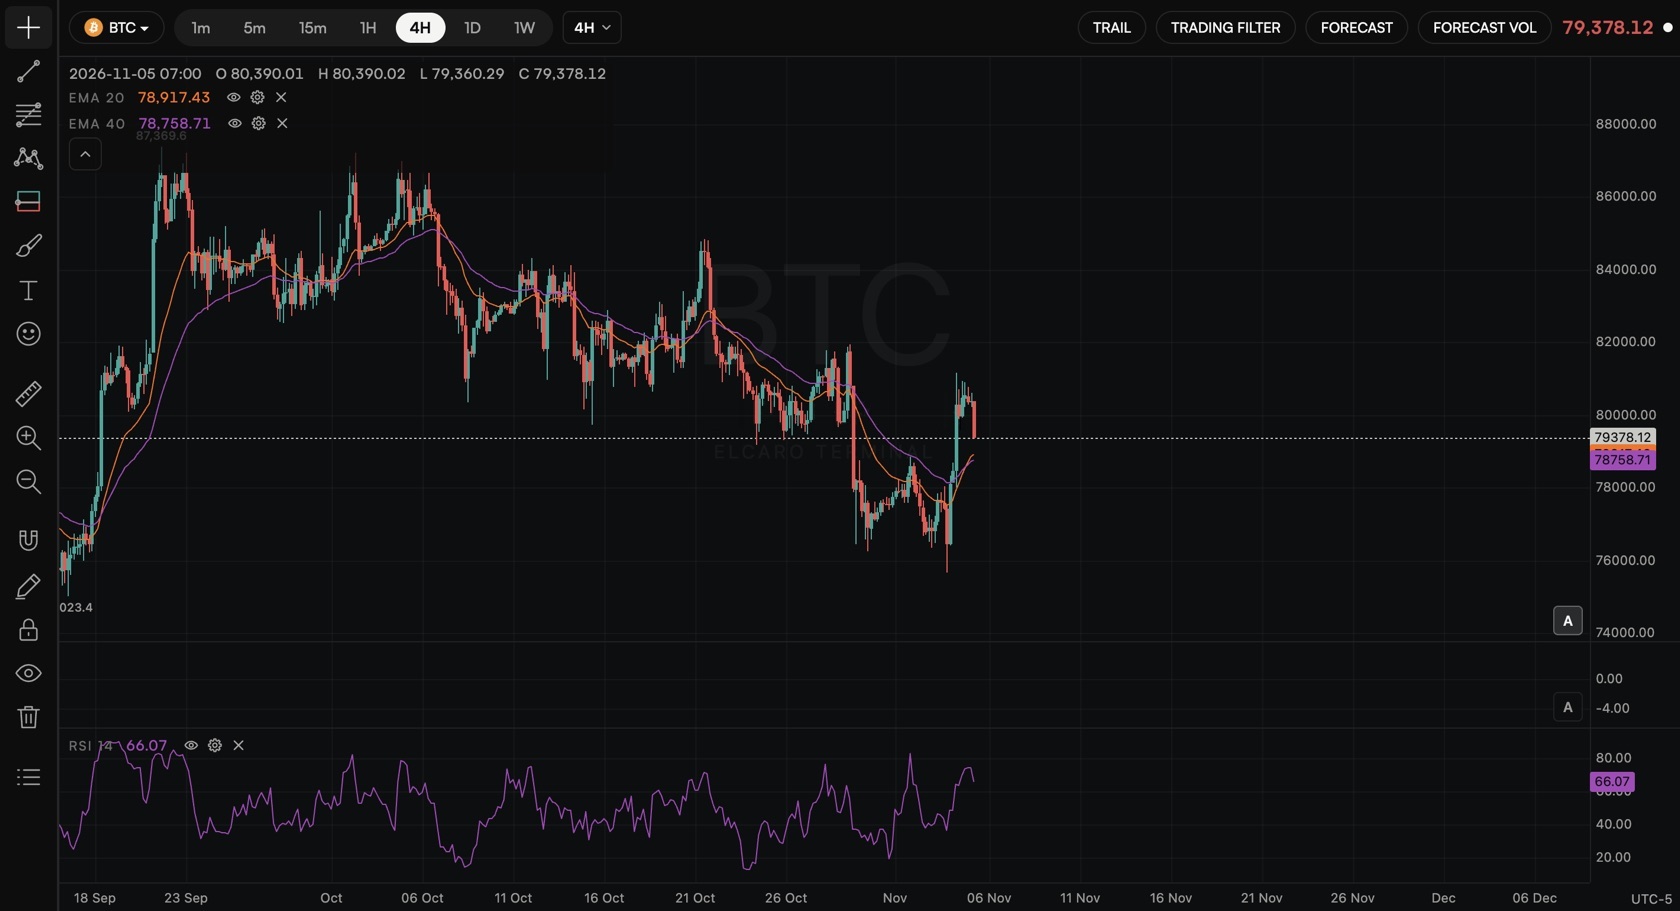
Next to the ELCARO indicators, the Terminal has 28 standard indicators with their usual public formulas, on every asset and timeframe.
Add, set up, remove
- 1. Click Indicators (fx), then find the indicator under Main pane or Sub pane, or search by name or code.
- 2. Click its row marked Add. It then reads On chart.
- 3. Use the buttons on its legend row: the eye hides or shows it, the gear opens its settings, × removes it.
- 4. Settings has Inputs, Style (Visible, colour and width of each line), Decimals and Reset to defaults. Ok keeps changes, Cancel drops them.
- 5. Drag the top edge of an indicator pane to resize it; double-click the edge for the default height.
Limits
- Up to 10 standard indicators and 4 indicator panes per chart.
- MA, EMA and WMA can be added several times; the others once per chart.
- Free access shows 2 standard indicators at a time across the whole workspace, shown as "N of 2 standard indicators in use". Extra saved ones are paused, not deleted.
Main pane (8), on the price chart
- Moving Average (MA): simple average of the close.
- Exponential MA (EMA): recent bars weigh more.
- Smoothed MA (SMA): slow, smoothed average.
- Weighted MA (WMA): linearly weighted average.
- Bollinger Bands (BOLL): volatility bands.
- Parabolic SAR (SAR): dots following the trend.
- Bull and Bear Index (BBI): four averages in one.
- Average Price (AVP): volume-weighted average price.
Sub pane (20), each in its own pane
- Volume (VOL): bars with three averages.
- MACD: gap of two averages, with a histogram.
- KDJ: stochastic with K, D and J.
- Relative Strength Index (RSI): rises vs falls, 0 to 100.
- Bias (BIAS): distance from the average, in percent.
- BRAR: two sentiment ratios around the open and previous close.
- Commodity Channel Index (CCI): typical price vs its average.
- Directional Movement Index (DMI): +DI, -DI, ADX, ADXR.
- CR (Energy Index): highs and lows vs the previous middle.
- Psychological Line (PSY): share of rising bars.
- Different of Moving Average (DMA): gap of two averages.
- TRIX: change of a triple-smoothed average.
- On Balance Volume (OBV): running volume total.
- Volume Ratio (VR): rising vs falling volume.
- Williams %R (WR): close within the range, -100 to 0.
- Momentum (MTM): close minus an earlier close.
- Ease of Movement (EMV): movement per unit of volume.
- Rate of Change (ROC): percent change.
- Price and Volume Trend (PVT): volume times percent change, summed.
- Awesome Oscillator (AO): gap of two midpoint averages.
In the news: free standard indicators · guide standard indicators
Read next
Switching indicators on and off
The Indicators window, the quick chips on the chart, the legend row with its eye, gear and remove buttons, and how settings work.
Using the Terminal without a plan
What you can do in the Terminal for free, the limit of 2 standard indicators, and a simple free setup step by step.
Moving Average (MA)
The simple moving average of the close on the price chart: how it is built, its settings and how to read it.
Relative Strength Index (RSI)
RSI in its own pane: a 0 to 100 oscillator comparing the size of rises and falls of the close over the period.