
Switching indicators on and off
The Indicators window, the quick chips on the chart, the legend row with its eye, gear and remove buttons, and how settings work.
The Indicators window
Click Indicators (the fx button) in the header. The window lists, from top to bottom:
- ELCARO: Forecast, Forecast VOL, TRAIL, Trading filter (VOL).
- ELCARO Options: Δ0.1 levels, Straddle σ boxes, Expected Move, Options data.
- Order flow: Liquidations, Large trades.
- Standard indicators: 28 classic indicators.
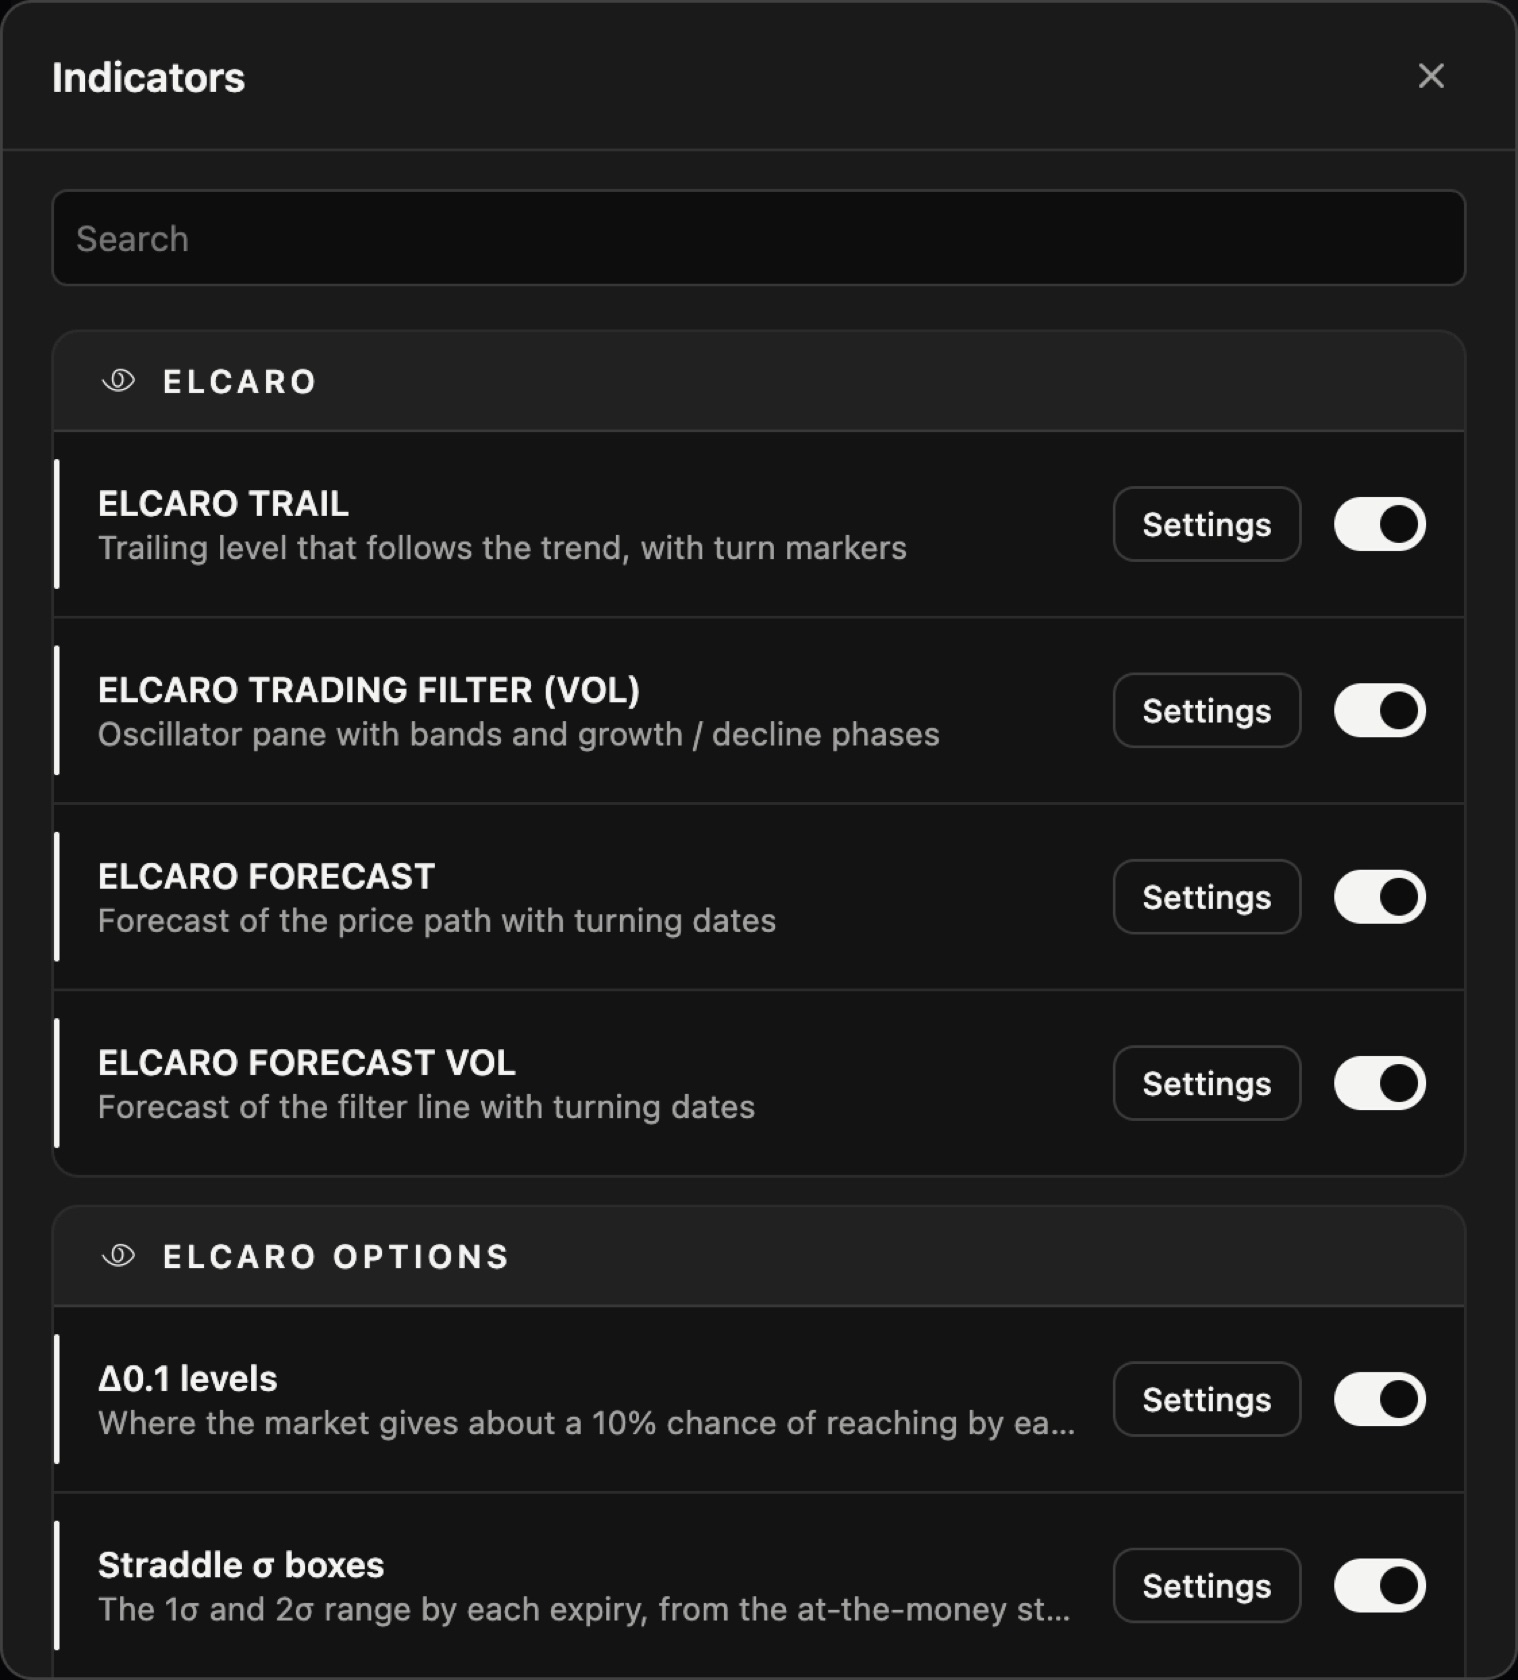
- Use the search box at the top to find any indicator by name.
- The switch on a row turns that indicator on or off for the chart you are working on.
- Settings on a row opens its settings window.
Quick chips on the chart
On a single chart, the chart header has four chips: TRAIL · TRADING FILTER · FORECAST · FORECAST VOL. Click a chip to turn that ELCARO indicator on or off without opening the window. In a layout with several charts, each chart has its own Indicators chip instead. On a phone, use the Indicators dropdown in the chart's top row.
The legend row
Every indicator on a chart has a row in the top-left corner of the chart.
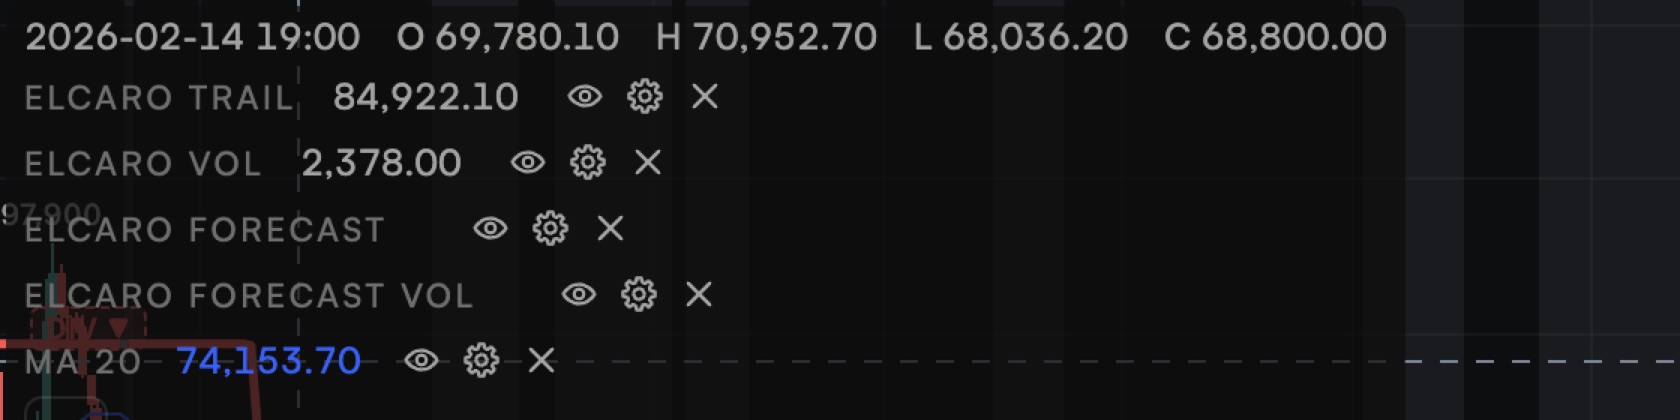
- Eye: hide or show the indicator without removing it.
- Gear: open its settings.
- ×: remove it from the chart. You can add it again from Indicators at any time.
ELCARO settings
- Each ELCARO indicator has its own settings window with the display options, an Opacity slider and Restore defaults.
- The calculation itself is fixed by the ELCARO engine, so every user sees the same ELCARO lines. Settings change only how they look.
Locked rows
If your plan does not cover the chart's asset or timeframe, the ELCARO, ELCARO Options and order flow rows are dimmed with a lock. On the web and in the Mini App, clicking a locked row shows the plans. Switch to an asset and timeframe your plan covers and the rows unlock.
Read next
ELCARO Forecast in the Terminal
How to switch the forecast on, read its solid and dashed parts, peaks and troughs, show turn dates, and set an alert before the next turn.
TRAIL and higher-timeframe trail levels
How TRAIL follows the trend, what a flip, a cross and the grey zone mean, how to show the 1H, 4H, 1D and 1W trail on one chart, and TRAIL alerts.
The trading filter and sigma levels
The trading filter pane step by step: VOL, the bands, the centre line, sigma levels, trend highlight, resizing the pane and alerts from a right-click.
Standard indicators
The 28 classic indicators of the Terminal, the two groups, how to add, set up, hide and remove one, and how many fit on a chart.