
Moving Average (MA)
The simple moving average of the close on the price chart: how it is built, its settings and how to read it.
Free for every account. No plan needed: add it to any chart, on any asset and any timeframe.
What it shows
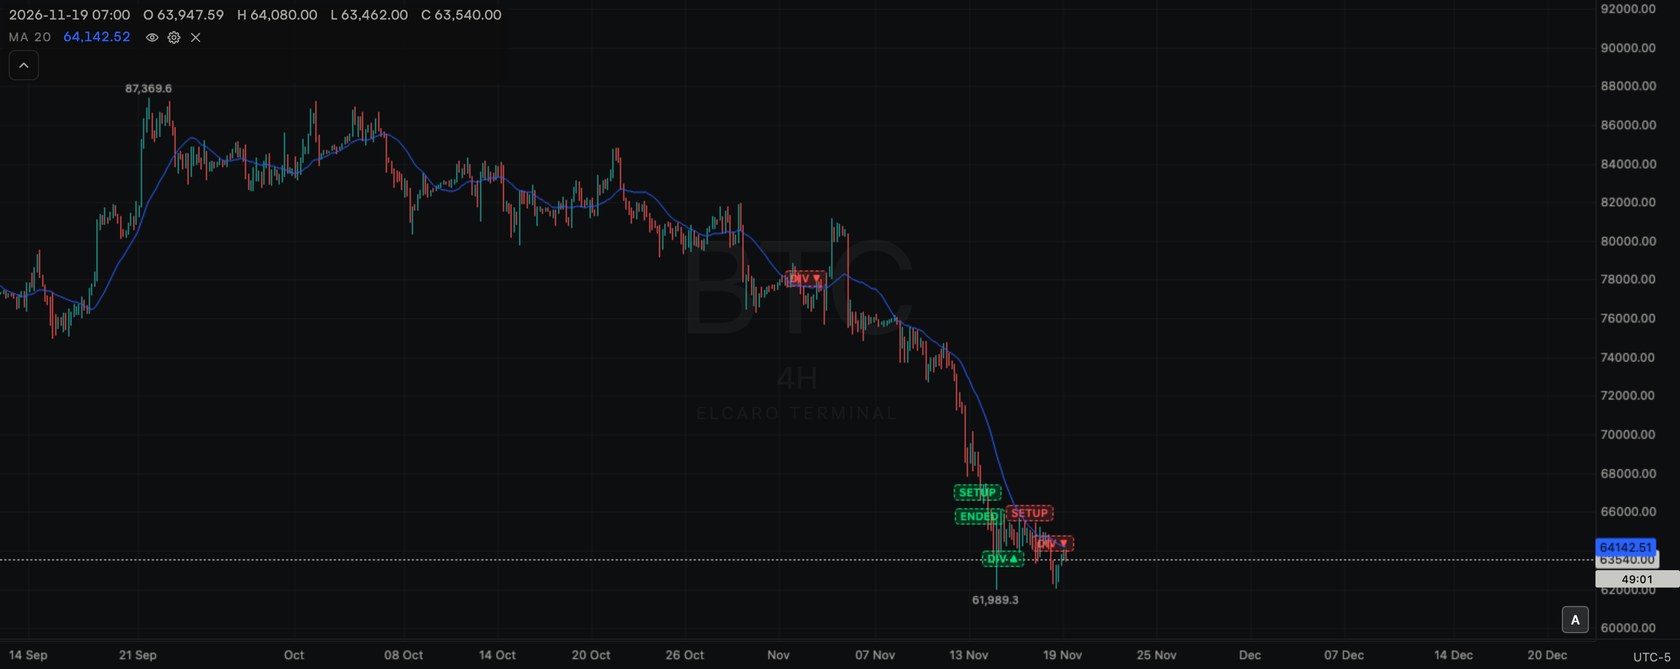
The Moving Average is the plain average of the last closes, drawn as one line on the price chart. Every bar in the period counts the same, so the line smooths out small swings and shows the general direction.
MA = sum of the last N closes / N
The line starts once the chart has N bars.
Add it to the chart
- 1. Click Indicators (fx) in the chart header.
- 2. Type
MAin the search box, or find it under Main pane. - 3. Click Moving Average. A blue line appears on the price chart and a legend row
MA 20appears in the top-left corner. - 4. To add a second one, click the row again. It reads "1 on chart · add another".
Settings
Click the gear on the legend row.
- Length: default 20, range 1–500.
- MA line: blue, width 1 px (1–5 px).
- Visible: switch to hide or show the line.
- Decimals: Automatic follows the price scale, or a fixed number.
- Reset to defaults returns the length, colour, width and decimals.
Each extra copy starts with its own colour and a bigger length (40, then 60), so the lines are easy to tell apart.
How to read it
- A rising line shows closes rising on average over the period; a falling line shows the opposite.
- Price above the line means the latest close is above the period's average; below means under it.
- A small length hugs the price, a big length moves slowly and smooths more.
- With two copies, the small-length line crossing the big-length line marks a change in which average is higher.
- Being an average of past closes, the line follows price with a delay.
Use it with ELCARO
- Put the MA next to TRAIL to compare a plain average with ELCARO's trailing level on the same candles.
- The MA describes the past closes; the ELCARO forecast draws an expected path ahead. Seeing both shows where the forecast sits against the recent average.
Good to know
- Uses only prices, so it works on every asset.
- Can be added several times per chart, each with its own length and colour.
- Each copy counts toward the 10 per chart and toward the free limit of 2 standard indicators at a time, also while hidden.
In the news: indicator ma
Read next
Exponential Moving Average (EMA)
The exponential moving average on the price chart: an average that weights recent closes more, its settings and how to read it.
Weighted Moving Average (WMA)
The linearly weighted moving average on the price chart: newest bar heaviest, oldest lightest, with settings and reading.
Bollinger Bands (BOLL)
Bollinger Bands on the price chart: a middle average with an upper and a lower band that widen and narrow with volatility.
Standard indicators
The 28 classic indicators of the Terminal, the two groups, how to add, set up, hide and remove one, and how many fit on a chart.