
Bollinger Bands (BOLL)
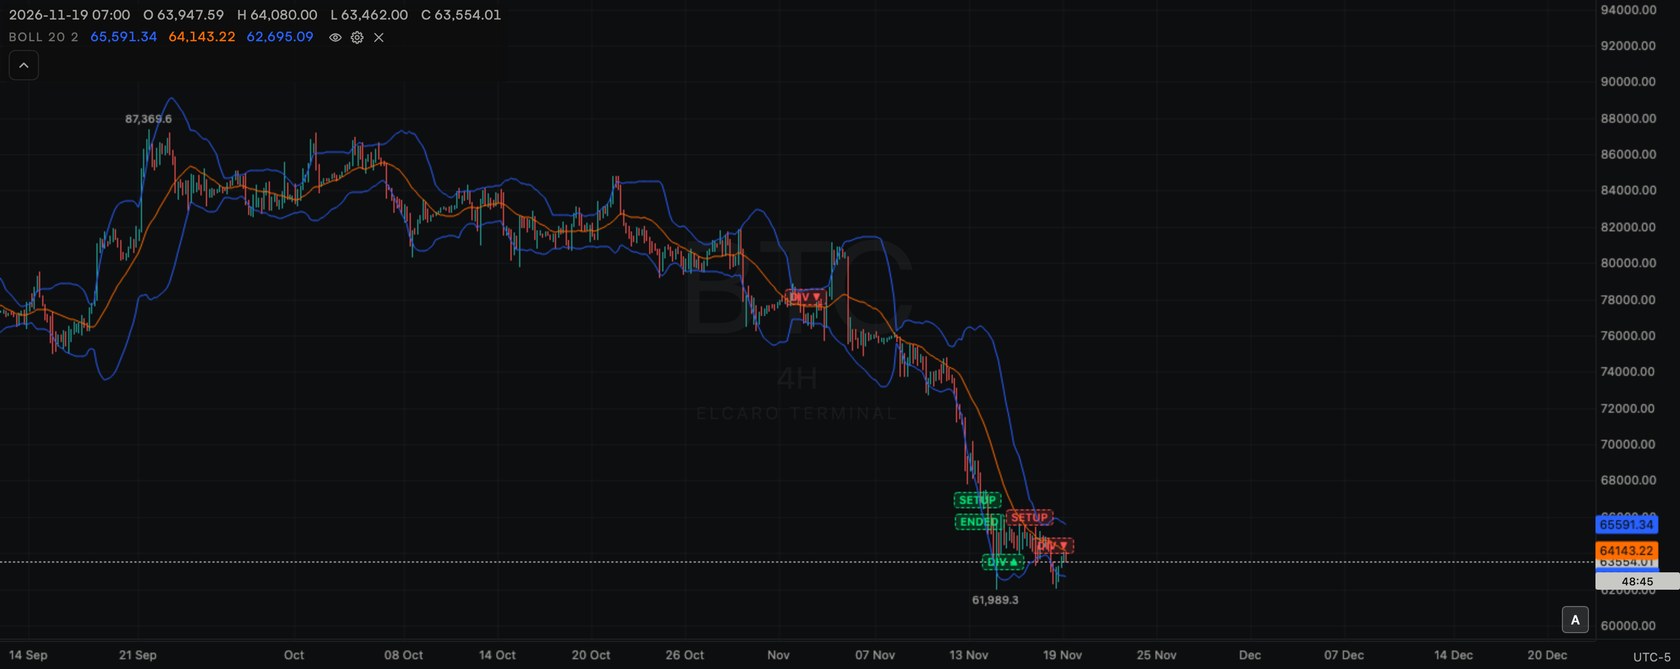
Bollinger Bands on the price chart: a middle average with an upper and a lower band that widen and narrow with volatility.
Free for every account. No plan needed: add it to any chart, on any asset and any timeframe.
What it shows
Bollinger Bands put three lines on the price chart. The middle one, Basis, is the simple average of the close. The Upper and Lower bands sit a number of standard deviations above and below it. When prices swing more, the bands move apart; when prices are calm, they come together.
Upper / Lower = Basis ± Deviation × standard deviation of the last N closes
Add it to the chart
- 1. Click Indicators (fx) in the chart header.
- 2. Type
BOLLin the search box, or find it under Main pane. - 3. Click Bollinger Bands. Three lines appear on the price chart, with a legend row
BOLL 20 2. - 4. Click the gear on the legend row to change it.
Settings
- Length: default 20, range 1–500.
- Deviation: default 2, range 0.1–10, in steps of 0.1.
- Upper: blue. Basis: orange. Lower: blue. Each 1 px wide (1–5 px).
- Visible: hide or show all three lines.
- Decimals: Automatic follows the price scale, or a fixed number.
- Reset to defaults returns both inputs, the colours, widths and decimals.
How to read it
- Wide bands show a period of large swings; narrow bands show a quiet period.
- A close at or outside a band shows a move far from the average, measured in that period's own volatility.
- With a deviation of 2, closes stay inside the bands most of the time, so touches of a band stand out.
- The Basis rising or falling shows the direction of the average itself.
- A lasting squeeze of the bands is often followed by wider swings, though not always in a set direction.
Use it with ELCARO
- Look at the bands' width next to the ELCARO filter (VOL) pane, which also shows how stretched a move is, in its own scale.
- See where the forecast's path runs against the current bands.
Good to know
- Uses only prices, so it works on every asset.
- One per chart.
- Counts toward the 10 per chart and toward the free limit of 2 standard indicators at a time, also while hidden.
- These bands are not the ELCARO Options σ boxes or the sigma levels of the filter pane.
In the news: indicator boll
Read next
Moving Average (MA)
The simple moving average of the close on the price chart: how it is built, its settings and how to read it.
Parabolic SAR (SAR)
Parabolic SAR on the price chart: dots below or above the bars that follow the trend and flip side when price crosses them.
Commodity Channel Index (CCI)
CCI in its own pane: how far the typical price sits from its average, scaled by its usual deviation.
Standard indicators
The 28 classic indicators of the Terminal, the two groups, how to add, set up, hide and remove one, and how many fit on a chart.