
Parabolic SAR (SAR)
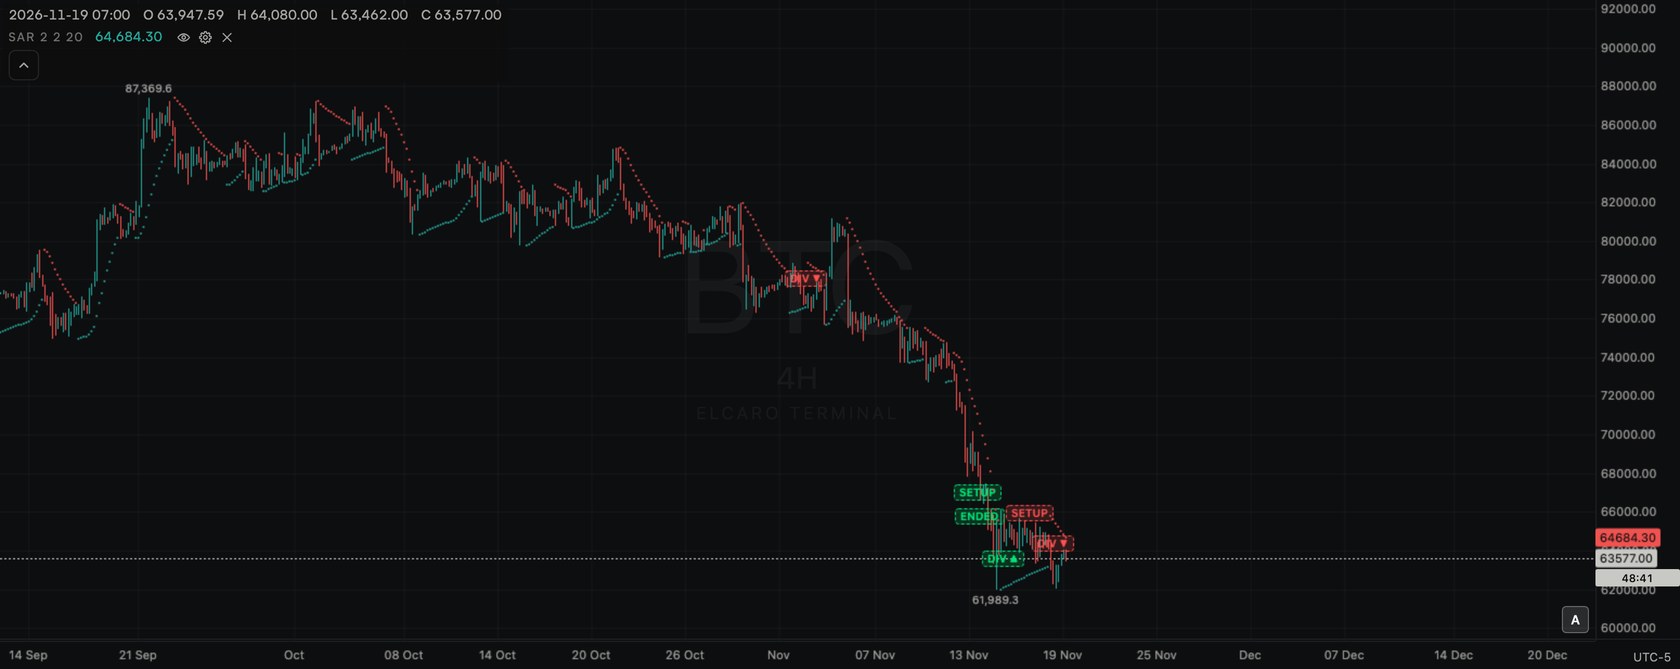
Parabolic SAR on the price chart: dots below or above the bars that follow the trend and flip side when price crosses them.
Free for every account. No plan needed: add it to any chart, on any asset and any timeframe.
What it shows
Parabolic SAR ("stop and reverse") draws one dot per bar. While price rises, the dots sit below the bars and climb toward them; while price falls, they sit above and come down. When price crosses the dots, they flip to the other side.
Each new dot moves toward the highest high (or lowest low) of the current run by an acceleration factor. The factor begins at Start, grows by Step each time the run makes a new extreme, and stops growing at Maximum. All three inputs are in hundredths, so the defaults mean 0.02, 0.02 and 0.20.
next SAR = SAR + factor × (extreme of the run − SAR)
Add it to the chart
- 1. Click Indicators (fx) in the chart header.
- 2. Type
SARin the search box, or find it under Main pane. - 3. Click Parabolic SAR. Dots appear on the price chart, with a legend row
SAR 2 2 20. - 4. Click the gear on the legend row to change it.
Settings
- Start (x0.01): default 2, range 1–100.
- Step (x0.01): default 2, range 1–100.
- Maximum (x0.01): default 20, range 1–100.
- Below price: teal dots. Above price: red dots.
- Visible: hide or show the dots.
- Decimals: Automatic follows the price scale, or a fixed number.
- Reset to defaults returns the inputs, colours and decimals.
How to read it
- Teal dots below the bars show a rising run; red dots above show a falling run.
- A flip from one side to the other marks the bar where price crossed the dots.
- Dots close to price show the run has been going for a while and the factor has grown.
- In a sideways market the dots flip often; in a steady move they flip rarely.
Use it with ELCARO
- Compare the SAR flips with TRAIL's turn markers; both are trailing levels, built in different ways.
- Check the side of the dots around the forecast's turning dates.
Good to know
- Uses only prices, so it works on every asset.
- One per chart.
- Counts toward the 10 per chart and toward the free limit of 2 standard indicators at a time, also while hidden.
In the news: indicator sar
Read next
Bollinger Bands (BOLL)
Bollinger Bands on the price chart: a middle average with an upper and a lower band that widen and narrow with volatility.
Bull and Bear Index (BBI)
The Bull and Bear Index on the price chart: one line that averages four moving averages of different lengths.
Directional Movement Index (DMI)
DMI in its own pane: +DI and -DI for upward and downward movement, with ADX and ADXR for the strength of the trend.
Standard indicators
The 28 classic indicators of the Terminal, the two groups, how to add, set up, hide and remove one, and how many fit on a chart.