
Directional Movement Index (DMI)
DMI in its own pane: +DI and -DI for upward and downward movement, with ADX and ADXR for the strength of the trend.
Free for every account. No plan needed: add it to any chart, on any asset and any timeframe.
What it shows
DMI splits each bar's movement into an upward part (how much the high rose above the previous high) and a downward part (how much the low fell below the previous low). Both are averaged over the period and divided by the average true range.
- +DI: the averaged upward movement, in percent of the range.
- -DI: the averaged downward movement.
- ADX: an average of the gap between +DI and -DI, relative to their sum. It shows how strong the trend is, not its direction.
- ADXR: the average of today's ADX and the ADX some bars ago.
DX = |+DI − −DI| / (+DI + −DI) × 100; ADX = average of DX
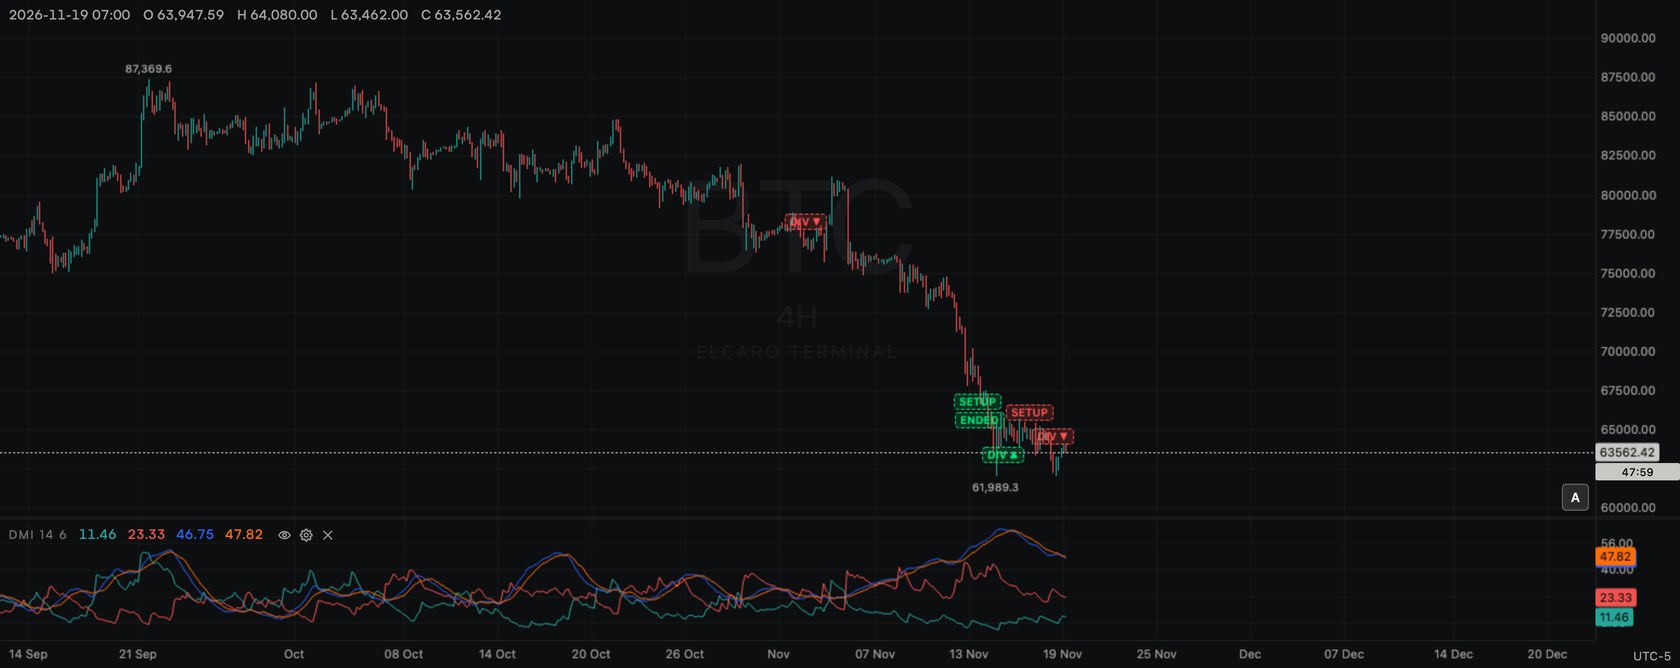
Add it to the chart
- 1. Click Indicators (fx) in the chart header.
- 2. Type
DMIin the search box, or find it under Sub pane. - 3. Click Directional Movement Index. A new pane opens under the price chart, with a legend row
DMI 14 6. - 4. Click the gear on the legend row to change it.
Settings
- DI period: default 14, range 1–500.
- ADX smoothing: default 6, range 1–500.
- +DI: teal. -DI: red. ADX: blue. ADXR: orange. Each 1 px wide (1–5 px).
- Visible, Decimals (Automatic shows 2, or a fixed number) and Reset to defaults.
- Pane height: drag the top edge of the pane; double-click it for the default height.
How to read it
- +DI above -DI shows upward movement outweighing downward over the period; the reverse shows the opposite.
- +DI and -DI crossing marks a change in which side dominates.
- A rising ADX shows a strengthening trend in either direction; a low or falling ADX shows a weak or sideways market.
- ADXR moves more slowly than ADX and smooths its swings.
Use it with ELCARO
- Use ADX as context for how strong the move is during the phases of the ELCARO filter (VOL) pane.
- Compare +DI / -DI crossings with TRAIL's turn markers.
Good to know
- Uses only prices, so it works on every asset.
- One per chart. Takes one of the 4 indicator panes per chart.
- Counts toward the 10 per chart and toward the free limit of 2 standard indicators at a time, also while hidden.
In the news: indicator dmi
Read next
Parabolic SAR (SAR)
Parabolic SAR on the price chart: dots below or above the bars that follow the trend and flip side when price crosses them.
MACD
MACD in its own pane: the DIF line, its smoothed DEA line and the histogram of the gap between them.
TRIX
TRIX in its own pane: the percent change of a triple-smoothed exponential average of the close, with its moving average.
Standard indicators
The 28 classic indicators of the Terminal, the two groups, how to add, set up, hide and remove one, and how many fit on a chart.