
Weighted Moving Average (WMA)
The linearly weighted moving average on the price chart: newest bar heaviest, oldest lightest, with settings and reading.
Free for every account. No plan needed: add it to any chart, on any asset and any timeframe.
What it shows
The WMA is an average of the close where weights fall in a straight line: the newest bar has weight N, the one before N − 1, and so on down to 1 for the oldest bar in the period. It reacts faster than a simple average and stops looking back after N bars, unlike the EMA.
WMA = (N × newest close + (N − 1) × previous close + … + 1 × oldest close) / (1 + 2 + … + N)
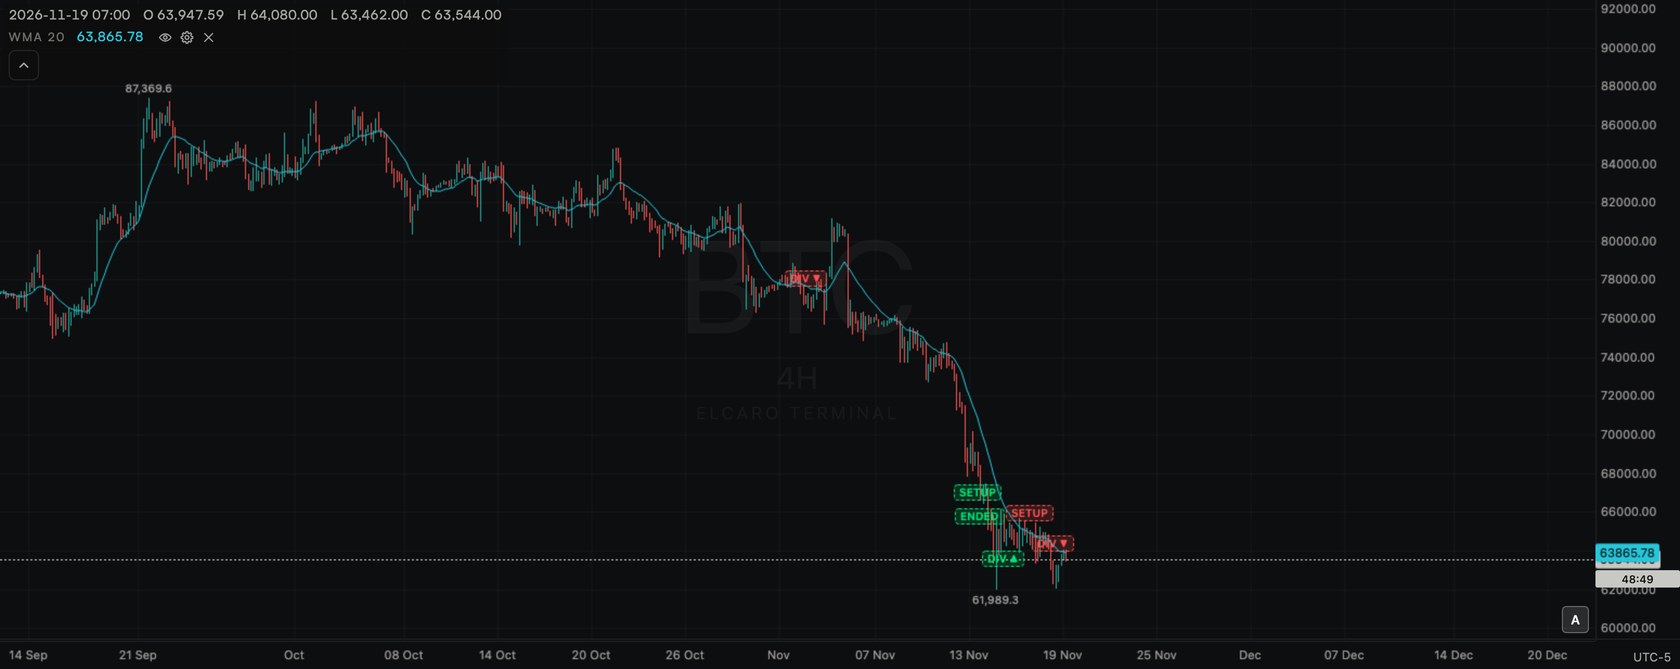
Add it to the chart
- 1. Click Indicators (fx) in the chart header.
- 2. Type
WMAin the search box, or find it under Main pane. - 3. Click Weighted Moving Average. A cyan line appears on the price chart, with a legend row
WMA 20. - 4. Click the row again for another copy.
Settings
Click the gear on the legend row.
- Length: default 20, range 1–500.
- WMA line: cyan, width 1 px (1–5 px).
- Visible: hide or show the line.
- Decimals: Automatic follows the price scale, or a fixed number.
- Reset to defaults returns the length, colour, width and decimals.
Each extra copy starts with its own colour and a bigger length (40, then 60).
How to read it
- A rising WMA shows recent closes weighted higher than older ones; a falling WMA shows the opposite.
- Next to an MA of the same length, the WMA turns earlier because the latest bars weigh most.
- A bar more than N bars old has no effect at all, so the line can jump when a large old bar leaves the period.
- Two WMAs of different lengths crossing marks a change in which average is higher.
Use it with ELCARO
- Use a WMA with the forecast's turning dates to see how recent closes were moving into each date.
- Compare the WMA's turns with TRAIL's turn markers on the same bars.
Good to know
- Uses only prices, so it works on every asset.
- Can be added several times per chart.
- Each copy counts toward the 10 per chart and toward the free limit of 2 standard indicators at a time, also while hidden.
In the news: indicator wma
Read next
Moving Average (MA)
The simple moving average of the close on the price chart: how it is built, its settings and how to read it.
Exponential Moving Average (EMA)
The exponential moving average on the price chart: an average that weights recent closes more, its settings and how to read it.
Smoothed Moving Average (SMA)
The smoothed moving average SMA(N, M) on the price chart: a slow, smoothed line of the close, with its two inputs explained.
Standard indicators
The 28 classic indicators of the Terminal, the two groups, how to add, set up, hide and remove one, and how many fit on a chart.