
Momentum (MTM)
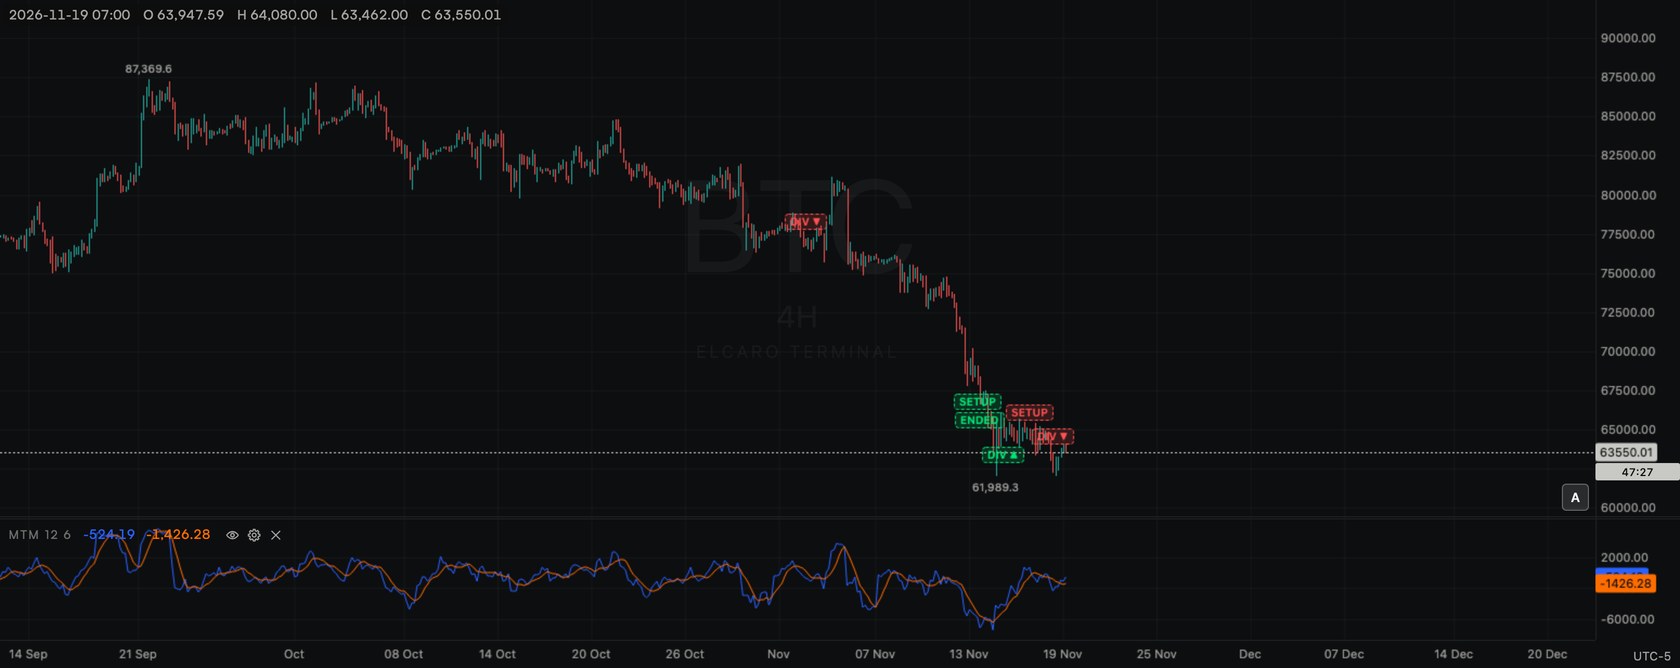
Momentum in its own pane: the close minus the close some bars ago, in price units, with its moving average.
Free for every account. No plan needed: add it to any chart, on any asset and any timeframe.
What it shows
Momentum is the simplest measure of speed: today's close minus the close N bars ago. When price climbs faster, MTM grows; when it slows down, MTM shrinks even if price still rises. A moving average of MTM is drawn with it.
MTM = close − close N bars ago
Add it to the chart
- 1. Click Indicators (fx) in the chart header.
- 2. Type
MTMin the search box, or find it under Sub pane. - 3. Click Momentum. A new pane opens under the price chart, with a legend row
MTM 12 6. - 4. Click the gear on the legend row to change it.
Settings
- Length: default 12, range 1–500.
- MA period: default 6, range 1–500.
- MTM: blue line. MA: orange line. Each 1 px wide (1–5 px).
- Visible, Decimals (Automatic follows the price scale, or a fixed number) and Reset to defaults.
- Pane height: drag the top edge of the pane; double-click it for the default height.
How to read it
- Above zero, the close is higher than N bars ago; below zero, lower.
- A rising MTM shows the move speeding up; a falling MTM shows it slowing down.
- MTM crossing zero marks the close crossing the level of N bars ago.
- MTM crossing its MA shows the speed leaving its recent level.
- Price making a new high while MTM makes a lower high (or the reverse at lows) is a divergence.
Use it with ELCARO
- Compare MTM slowing down with the forecast's turning dates.
- Read MTM next to the ELCARO filter (VOL) pane, which shows the growth and decline phases in its own scale.
Good to know
- Uses only prices, so it works on every asset.
- One per chart. Takes one of the 4 indicator panes per chart.
- Counts toward the 10 per chart and toward the free limit of 2 standard indicators at a time, also while hidden.
- Values are in price units. For a percent version, use Rate of Change (ROC).
In the news: indicator mtm
Read next
Rate of Change (ROC)
ROC in its own pane: the percent change of the close against the close some bars ago, with its moving average.
TRIX
TRIX in its own pane: the percent change of a triple-smoothed exponential average of the close, with its moving average.
MACD
MACD in its own pane: the DIF line, its smoothed DEA line and the histogram of the gap between them.
Standard indicators
The 28 classic indicators of the Terminal, the two groups, how to add, set up, hide and remove one, and how many fit on a chart.