
Psychological Line (PSY)
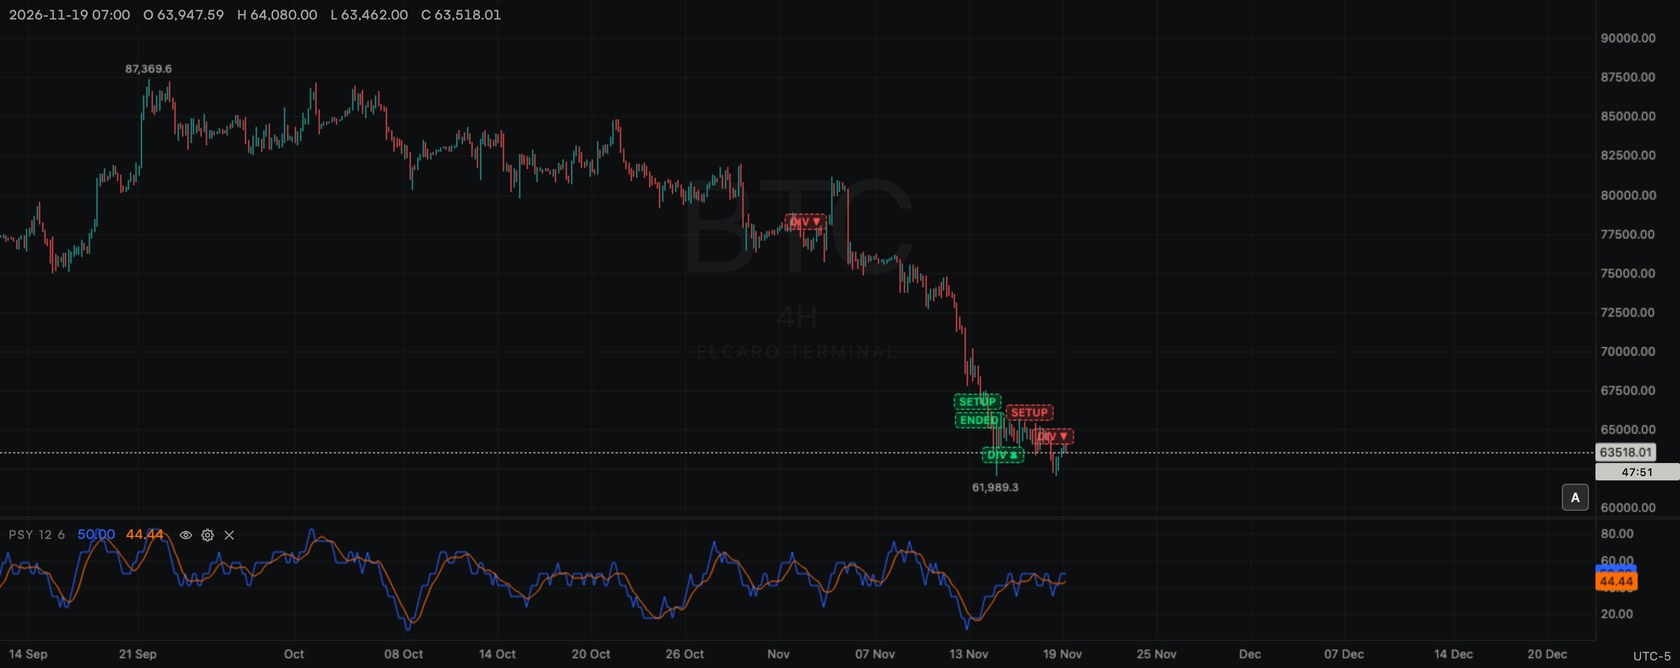
PSY in its own pane: the share of bars that closed higher than the bar before, in percent, with its moving average.
Free for every account. No plan needed: add it to any chart, on any asset and any timeframe.
What it shows
The Psychological Line counts how many of the last bars closed above the previous close, and shows that count as a percent of the period. It ignores how big each move was; only the number of rising bars matters. A moving average of PSY is drawn with it.
PSY = number of bars with close above the previous close / N × 100
Add it to the chart
- 1. Click Indicators (fx) in the chart header.
- 2. Type
PSYin the search box, or find it under Sub pane. - 3. Click Psychological Line. A new pane opens under the price chart, with a legend row
PSY 12 6. - 4. Click the gear on the legend row to change it.
Settings
- Length: default 12, range 1–500.
- MA period: default 6, range 1–500.
- PSY: blue line. MA: orange line. Each 1 px wide (1–5 px).
- Visible, Decimals (Automatic shows 2, or a fixed number) and Reset to defaults.
- Pane height: drag the top edge of the pane; double-click it for the default height.
How to read it
- At 50, half the bars in the period closed higher.
- Above 50, rising bars outnumber falling ones; below 50, the opposite.
- Values near 75 or 25 show a run of mostly rising or mostly falling bars.
- PSY moves in steps, because it counts bars; the MA line smooths those steps.
- A few large bars can move price a lot while PSY barely changes, since size is not counted.
Use it with ELCARO
- Compare PSY's share of rising bars with the growth and decline phases of the ELCARO filter (VOL) pane.
- Check PSY in the bars leading into the forecast's turning dates.
Good to know
- Uses only prices, so it works on every asset.
- One per chart. Takes one of the 4 indicator panes per chart.
- Counts toward the 10 per chart and toward the free limit of 2 standard indicators at a time, also while hidden.
In the news: indicator psy
Read next
BRAR
BRAR in its own pane: two sentiment ratios comparing the push above and below the open and the previous close.
CR (Energy Index)
CR in its own pane: how far highs and lows reach from the previous bar's middle price, with four moving averages.
Relative Strength Index (RSI)
RSI in its own pane: a 0 to 100 oscillator comparing the size of rises and falls of the close over the period.
Standard indicators
The 28 classic indicators of the Terminal, the two groups, how to add, set up, hide and remove one, and how many fit on a chart.