
How far the market expects price to move.
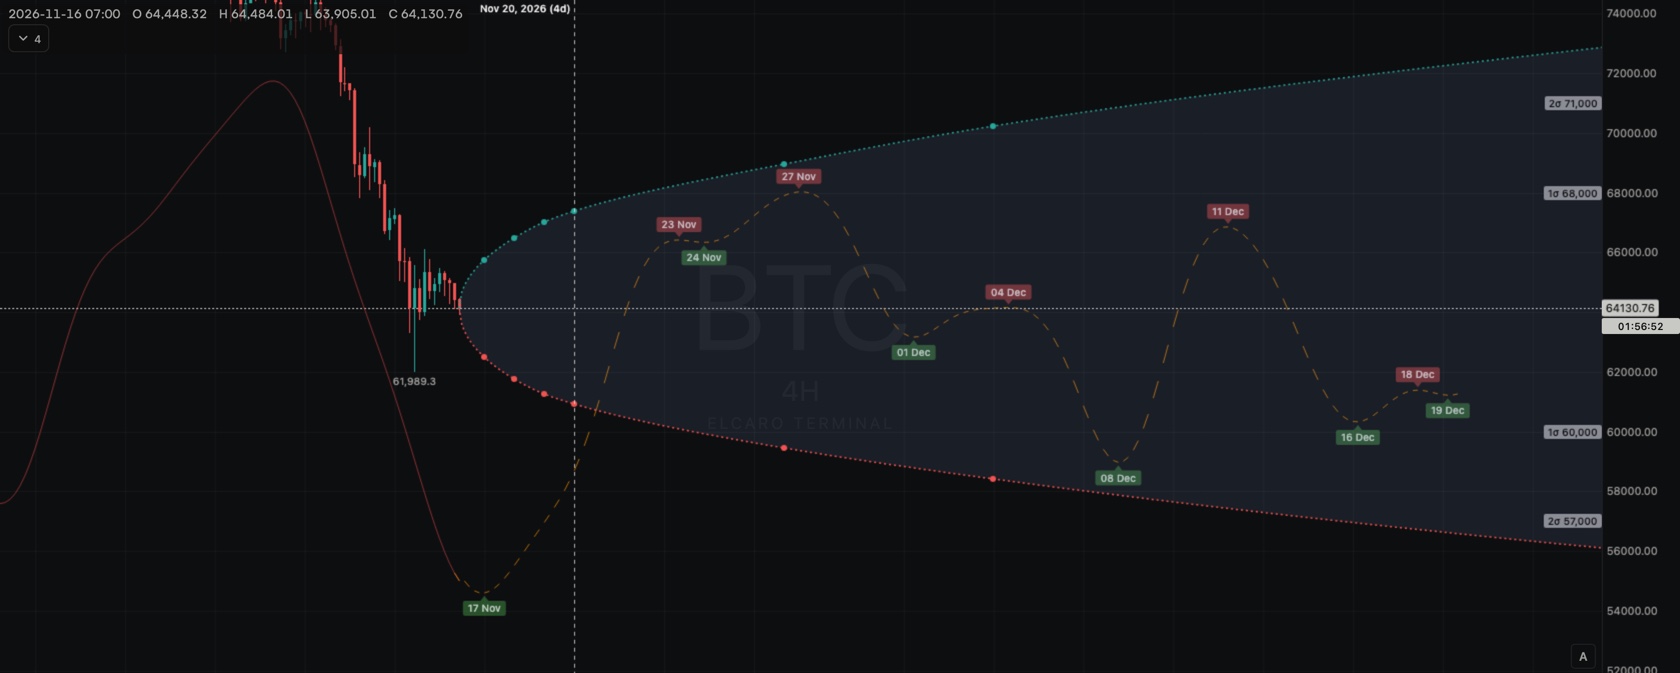
A cone from the last candle, with a point above and below the price at every listed expiry: the 1σ range, about 68%, that the options market implies by that date.
Market-implied values, not a forecast. 16 crypto, stock and ETF underlyings, within your plan.
01
A cone across expiries
Hover an expiry for the expected move in dollars and percent, implied volatility and the upper and lower prices.
- The cone widens with time, as the options market expects bigger moves further out.
- The options table lists every expiry with its straddle, implied volatility, break-even, ranges and Δ0.1 levels.
- Pick any expiry date in the table to see its expected move.
Step by step in the guide
Questions.
What is the expected move? +
The 1σ range the options market implies for an expiry. About 68% of the time price stays inside it by that date.
Is it a forecast of direction? +
No. It is symmetric and says how far, not which way. For timing of phases, use the ELCARO forecast.
Related features
Δ0.1 levels Where the options market gives price only about a 10% chance of reaching by each expiry. Straddle σ ranges The 1σ and 2σ range by each expiry, built from the at-the-money straddle. BTC volatility Not which way BTC moves, but how wide its swings are expected to be.
Educational tools, not financial advice. ELCARO never places orders for you.