
Where price is unlikely to go.
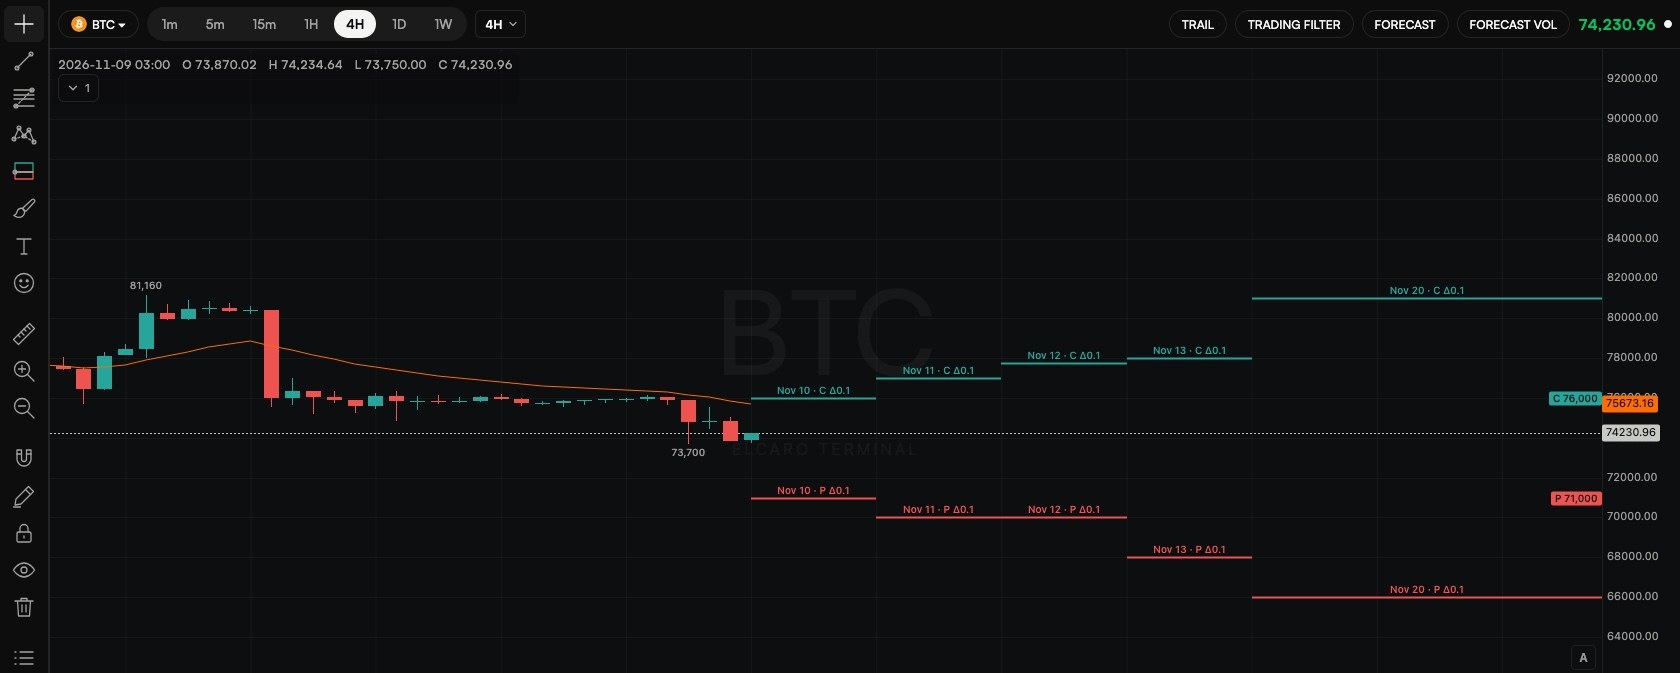
For each expiry, ELCARO draws a line above the price and a line below it where the options market gives only about a 10% chance of being reached by that expiry. Put the other way: for each line, the market gives about a 90% chance that price does not reach it by that expiry.
Market-implied values from live options prices, not a forecast. 16 crypto, stock and ETF underlyings, within your plan.
01
Two lines per expiry
C Δ0.1 above the price, P Δ0.1 below it, each running to its own expiry.
- An option's delta is roughly the market-implied chance of price reaching its strike by expiry.
- Delta 0.1 means about a 10% chance: up through the upper line, down through the lower one.
- Future expiries are drawn right of the last candle, and the lines move live.
02
A boundary the market itself draws
Read the lines as the edges of what the options market treats as likely by a date.
- Hover a line for the expiry, time left, strike, its chance, the option price and implied volatility.
- Choose Daily (up to 14 days ahead), Weekly, Monthly or All expiries.
- Read it next to the ELCARO forecast: the forecast dates the phases, the options draw the likely range.
Step by step in the guide
Questions.
What does Δ0.1 mean? +
The strike where an option's delta is about 0.1. Delta roughly equals the market-implied chance of price reaching that strike by expiry, so the line marks about a 10% chance.
So price will not reach the line? +
Not necessarily. The options market gives it about a 10% chance by that expiry. The levels are market-implied values and change as options prices change.
Is it a forecast? +
No. It is what the options market implies right now. The ELCARO forecast is a separate, algorithmic layer.
Which assets? +
BTC, ETH, SOL, XRP, DOGE, MNT, HYPE, XAUT, NVDA, TSLA, QQQ, SPCX, SNDK, SKHY, MU and SOXL.
Related features
Educational tools, not financial advice. ELCARO never places orders for you.