
What the options market is doing, in one panel.
The options data panel gathers what the options market is doing on an asset: volume, open interest by strike, the put/call ratio, implied volatility and recent trades. Float it over the chart or dock it as a tab.
Market-implied values, not a forecast. In the ELCARO Terminal, within your plan.
01
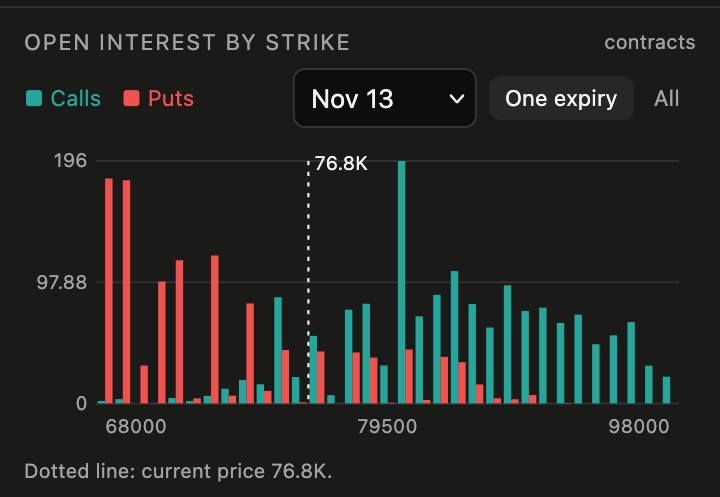
Open interest by strike
Calls and puts at every strike, for one expiry or all of them, with the current price marked by a dotted line.
- Tall bars show the strikes where many options are open.
- Switch the expiry to see how the picture changes from this week to next month.
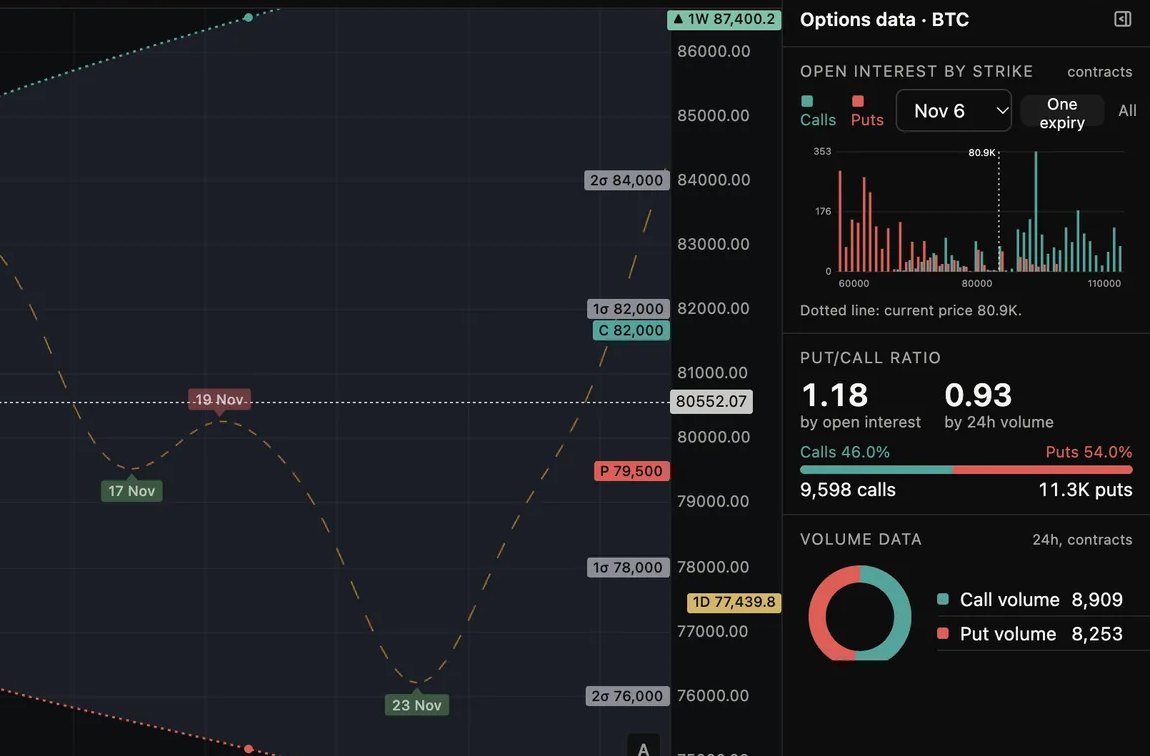
- The Δ0.1 lines on the chart come from the same options chain. Δ0.1 levels by expiry
02
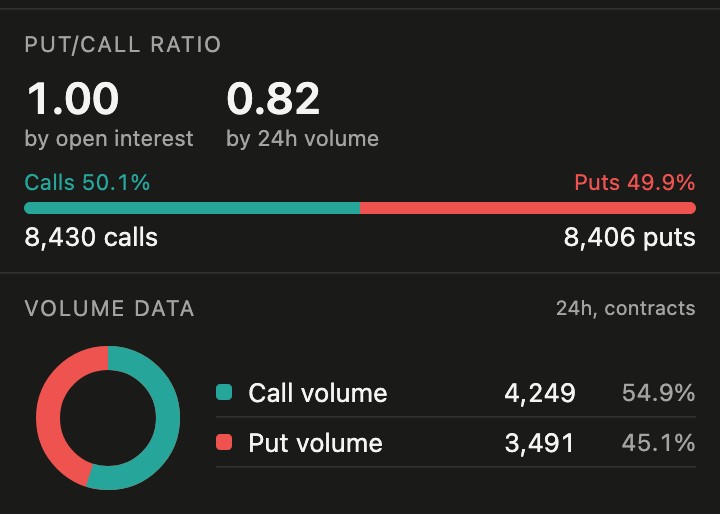
Put/call ratio and volume
Two ratios side by side: one by open interest, one by the last 24 hours of volume.
- Above 1 means more puts than calls; below 1, more calls.
- The bar splits calls and puts by share, with the counts under it.
- Volume data shows call and put volume over 24 hours, in contracts and as a share.
03
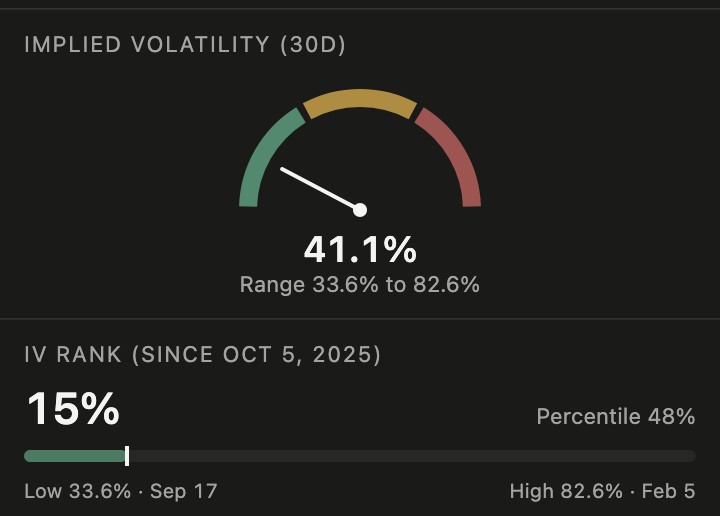
Implied volatility, rank and percentile
The 30-day implied volatility on a gauge, with the range it has moved in.
- IV rank places today's level between the low and the high of the stored history.
- The percentile shows how often the level has been lower.
- Higher implied volatility means the options market expects bigger moves. Expected move from IV
04
The smile and the term structure
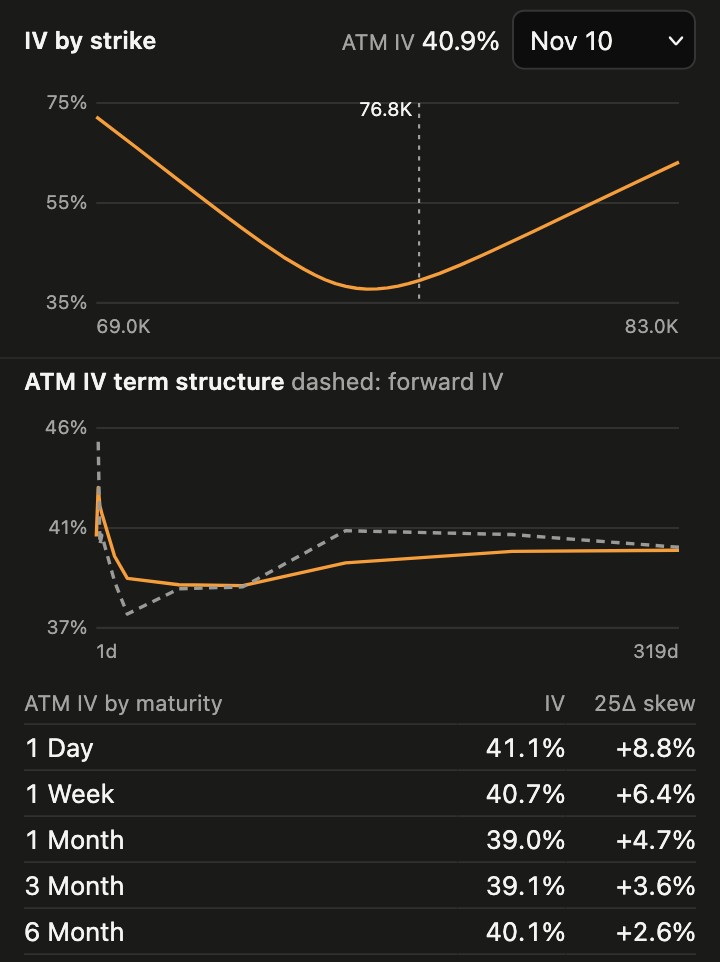
How implied volatility changes across strikes for one expiry, and across expiries from one day to several months.
- IV by strike draws the smile, with at-the-money IV and the current price marked.
- The term structure shows at-the-money IV by maturity, with the forward IV dashed.
- The table lists 1 day to 6 months with the 25Δ skew. σ ranges by expiry
05
Recent options trades
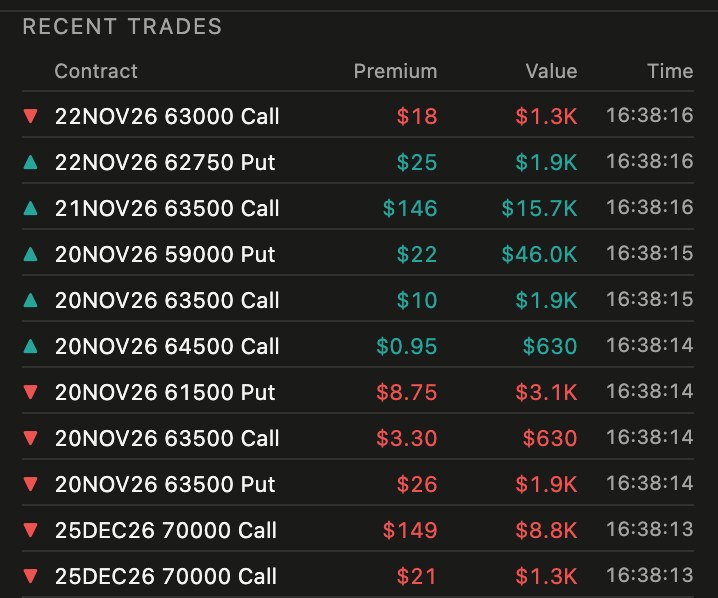
The latest options trades on the asset as they print, with the premium and the value in dollars.
- Each row shows the contract, the premium paid, the value and the time.
- Large trades on the underlying sit in the order flow panel. Order flow and large trades
- The same options data draws the levels on the chart. Options levels in the Terminal
Step by step in the guide
Questions.
Which assets have options data? +
The same 16 underlyings as the options levels: BTC, ETH, SOL, XRP, DOGE, MNT, HYPE, XAUT, NVDA, TSLA, QQQ, SPCX, SNDK, SKHY, MU and SOXL.
Why do some history figures say they need more days? +
Figures based on history need a few weeks of stored data on some assets and say so until then.
Related features
Educational tools, not financial advice. ELCARO never places orders for you.