
Is this stretch normal, or rare?
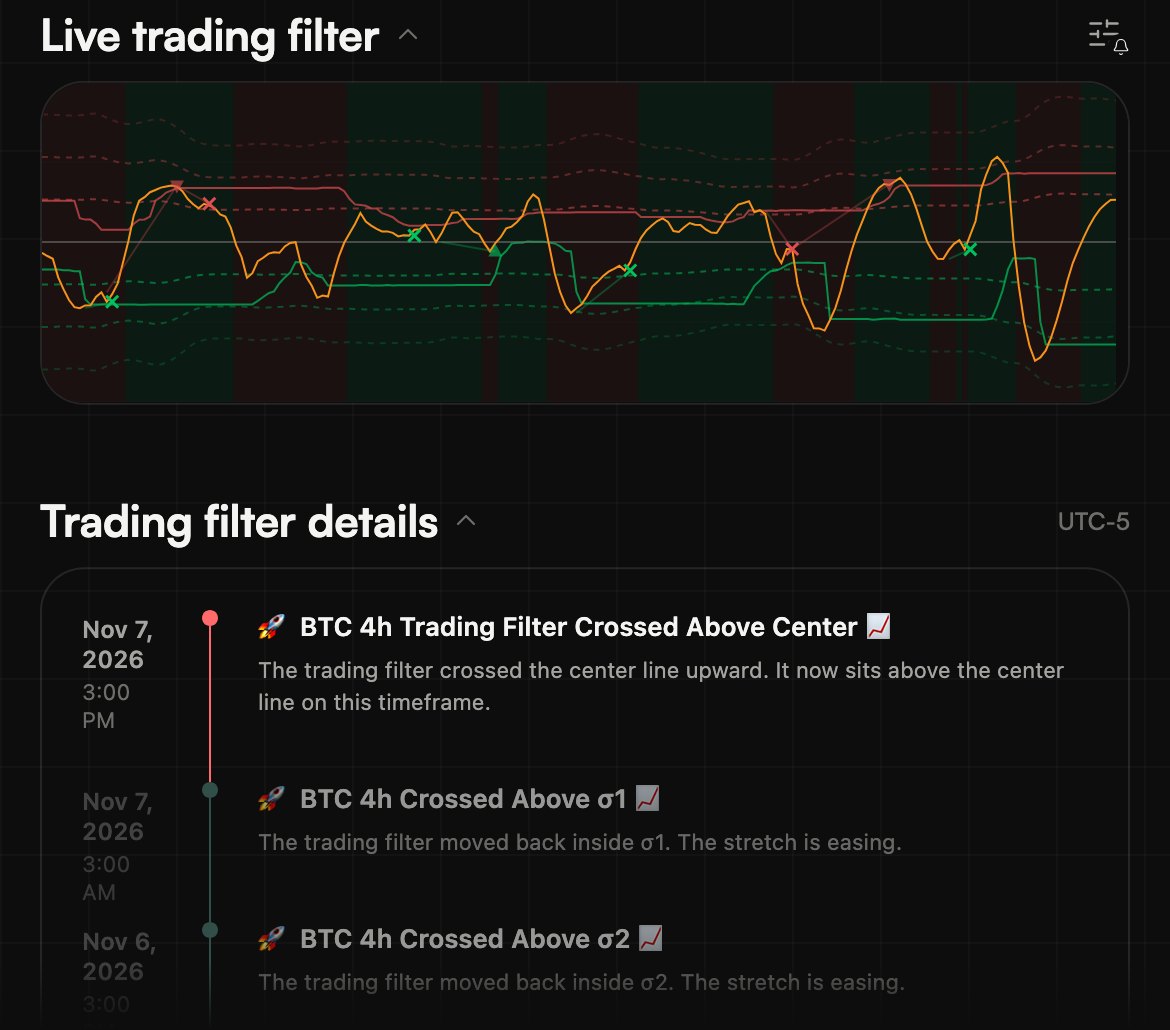
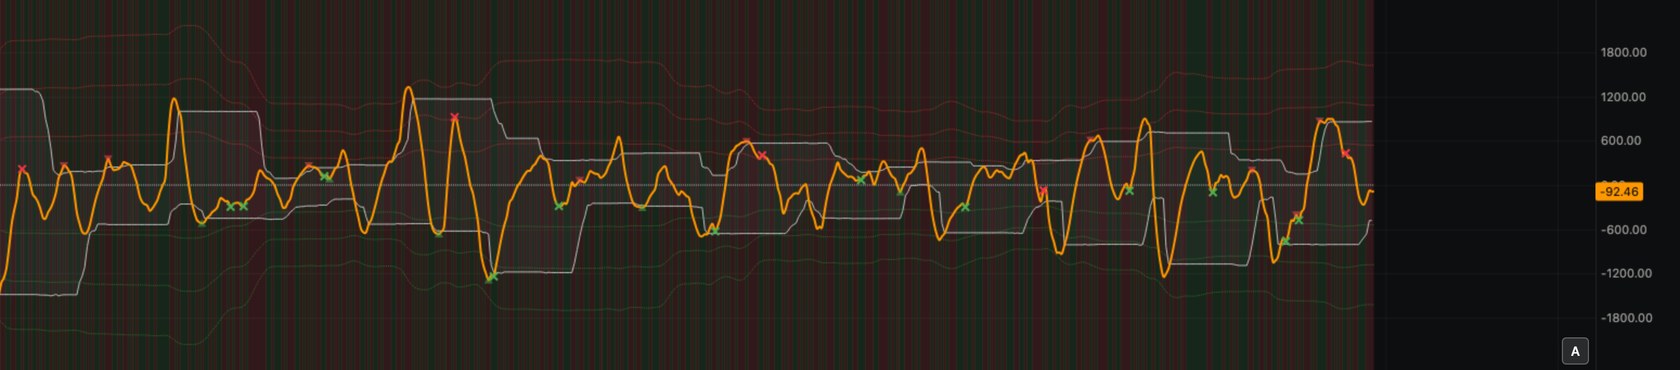
Sigma levels are dotted lines on the trading filter, not on the price chart. They show how unusual the filter's current reading is compared with its own recent behaviour.
In the ELCARO app and the Terminal, within your plan.
01
Measured on the filter's own history
σ1 is one standard deviation of the filter over its last 100 bars. σ2 and σ3 sit at two and three times that.
- Inside ±σ1 about 68% of the time, ±σ2 about 95%, ±σ3 about 99.7%.
- A cross beyond σ2 is a stretch seen about 5% of the time; beyond σ3 about 0.3%.
- The app records each cross in the event list.
02
Context, not a target
A rare stretch makes a pause or a turn more likely than usual, and says nothing about when or how far.
- It is not a price target and not a probability of reversal.
- Look at the forecast dates first: a deep stretch late in a phase is more notable than one right after it begins.
- These are not the options σ ranges, which sit on the price itself.
Step by step in the guide
Questions.
What does σ2 mean? +
Two standard deviations of the filter's own value over its last 100 bars. The filter stays inside ±σ2 about 95% of the time, so a cross beyond it is a stretch seen about 5% of the time.
Is a σ cross a reason to act? +
No. It says the stretch is rare. It does not say when or how far anything will change, and it is not a probability of reversal.
Are these the same as the options σ ranges? +
No. Options σ ranges are built from options prices and drawn on the price chart. Sigma levels are drawn on the trading filter.
Can I get notified of a σ cross? +
Yes, in the ELCARO app: turn on σ crosses in Profile → Notifications for your assets and timeframes.
Related features
Educational tools, not financial advice. ELCARO never places orders for you.