
How far price has stretched, measured against itself.
The trading filter is the oscillator under the price. It measures how far the price has stretched from its own dynamic channel, a band the filter recalculates from the market, with nothing for you to configure.
In the ELCARO app and the Terminal, within your plan.
01
In the app: the live filter and its events
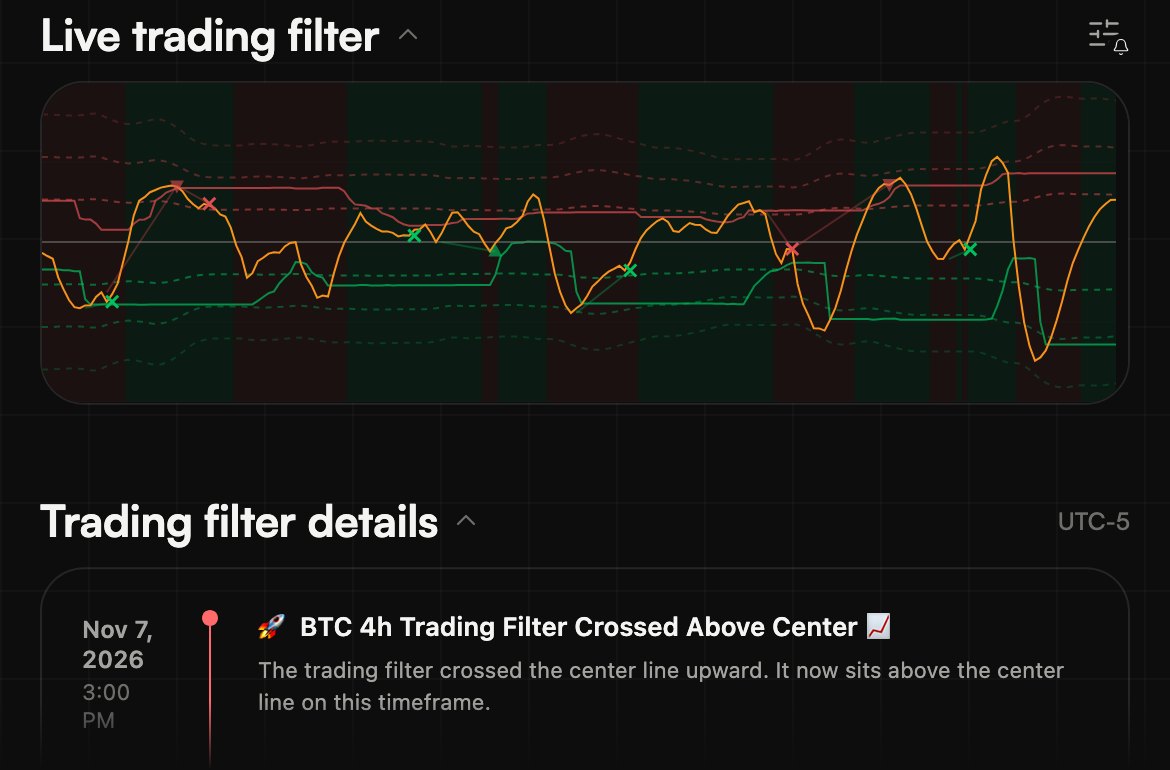
Under every asset chart, with an event recorded each time the curve crosses a level.
- The curve is the current reading; the bands are the edges of the channel and move with volatility.
- Which side of the centre the curve sits on shows which way the stretch leans.
- Each event is a factual record: this asset, this timeframe, this level, at this moment.
02
In the Terminal: a full-size pane
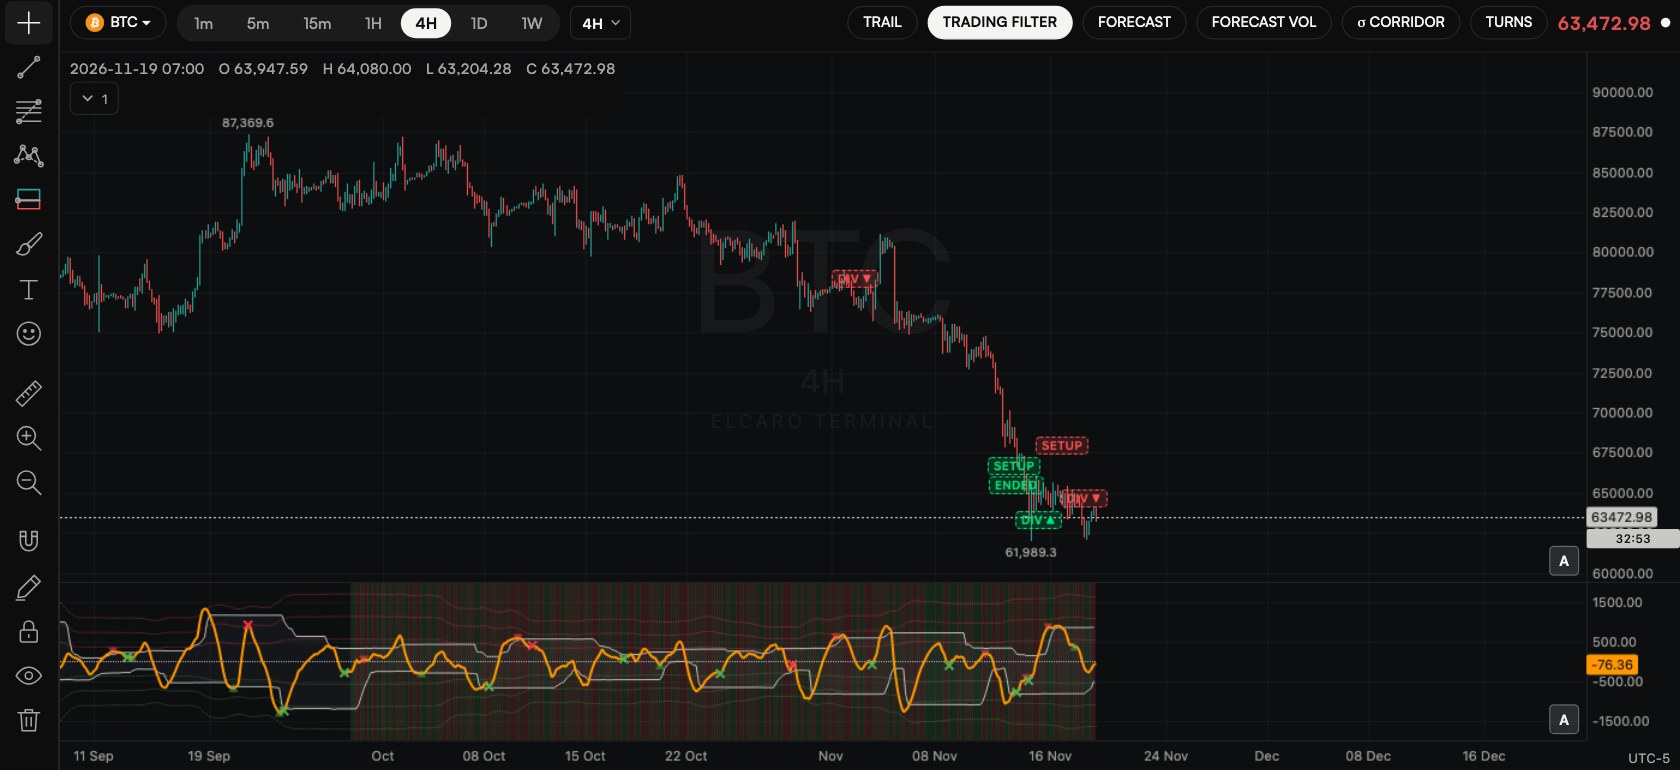
VOL, HighBand and LowBand, the centre line and sigma levels in a pane you can resize.
- An optional trend highlight colours the background by phase.
- Divergence marks show in the same pane.
- Right-click the pane for ready alerts on the centre line and the bands.
Step by step in the guide
Questions.
Do I need to set up the channel? +
No. The filter recalculates its channel from the market itself. There is nothing to configure.
Why does the filter look different on 1H and 1D? +
It describes the swings of the timeframe you are looking at. Higher timeframes have wider, rarer swings; lower ones narrower and more frequent. Both readings are correct.
Is an event an instruction? +
No. An event records what the filter did. It is a description, not an instruction.
Which plan do I need? +
An app plan opens it on the assets and timeframes of that plan; the Terminal plan opens it on every asset and timeframe.
Related features
Educational tools, not financial advice. ELCARO never places orders for you.