
Not only where the filter is. Where it is heading.
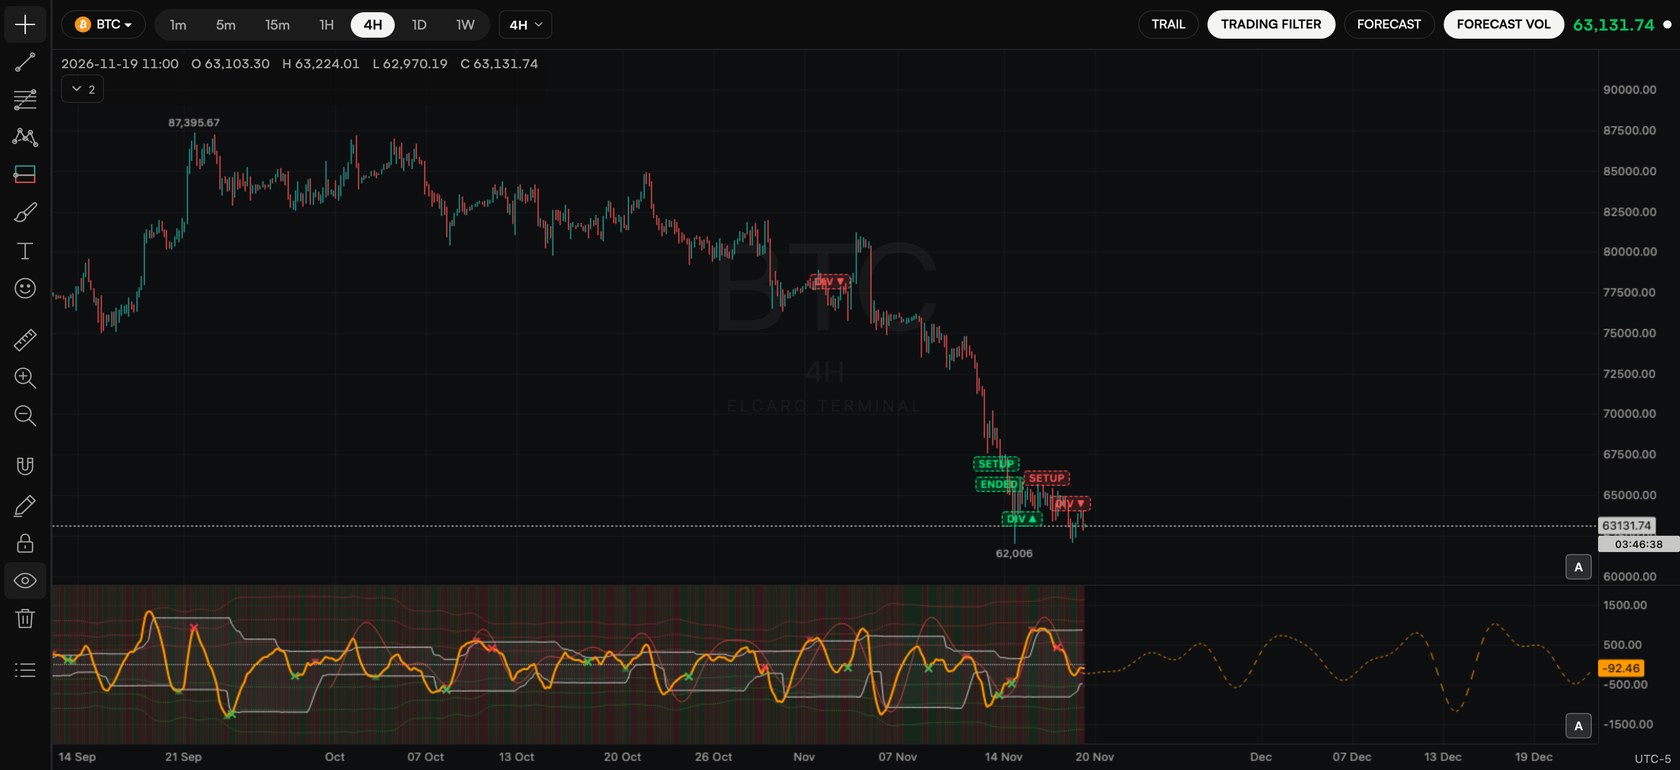
Forecast VOL is a forecast of the trading filter line. A dashed curve continues the filter to the right of the last bar and marks where it is expected to peak and bottom, with its own turn dates.
Algorithmic, not AI. In the ELCARO Terminal, within your plan.
01
A dashed curve inside the filter pane
Switch on the trading filter, then the FORECAST VOL chip. The curve continues the filter line past the last bar.
- Its peaks and troughs show where the filter is expected to turn.
- Turn dates put a date chip on each of them.
- You can also draw it over the candles, on its own scale.
02
Read it with the price forecast
The price forecast dates the phases of price. Forecast VOL dates the swings of the filter.
- When both turn around the same time, the picture is easier to read.
- When they disagree, give the timing less weight.
- Like the price forecast, it shows timing and shape, not levels.
Step by step in the guide
Questions.
How is Forecast VOL different from the forecast? +
The forecast draws the expected path of the price cycle. Forecast VOL draws the expected path of the trading filter line, with its own turn dates.
Can I get an alert on a Forecast VOL turn? +
Yes. Create alert → Forecast → FORECAST VOL turn, then choose the turn and how many bars before it (0 to 30; 0 means when it is reached).
Is it made by AI? +
No. Forecast VOL is algorithmic, like the rest of the ELCARO indicator.
Which plan do I need? +
An app plan opens it on the assets and timeframes of that plan; the Terminal plan opens it on every asset and timeframe.
Related features
Educational tools, not financial advice. ELCARO never places orders for you.