
What ELCARO shows you
The two things on every asset page — the forecast and the trading filter — and why they are read together.
ELCARO is built around one idea: where the market is heading and where it is right now are two different questions, and the app answers them with two different tools.
The forecast
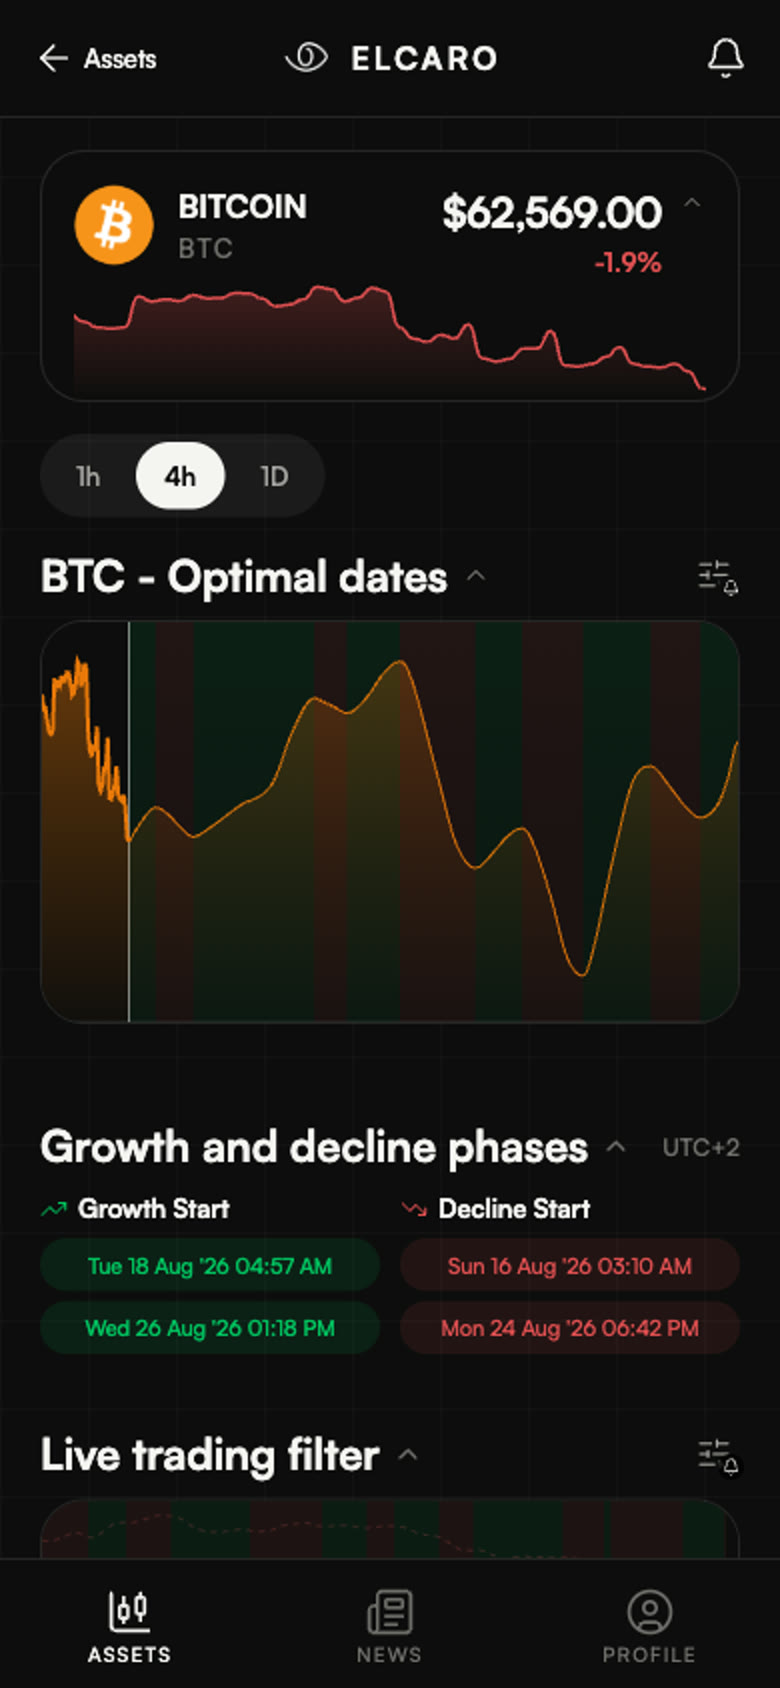
The forecast maps the asset into growth phases and decline phases and marks the dates where one turns into the other. It answers "which way is this leaning, and until roughly when".
The trading filter
The trading filter is the oscillator under the price chart. It tracks how far the price has stretched from its own dynamic channel right now, and records an event every time it crosses one of the channel's levels. It answers "where inside that phase are we at this moment".
Why both
A phase is not a straight line. Inside a growth phase there are falling days, and inside a decline phase there are rising ones — that is normal, not a broken forecast. The forecast gives you the direction of the season; the filter tells you what today looks like inside it.
Reading only one of them is what usually causes confusion. If the forecast says growth and the filter is at the top of its channel, those two statements do not contradict each other — they describe different time scales.
Where to find them
Open any asset from the home list. The page carries the price chart, the forecast dates, the live trading filter and its event history, one under another. Every block folds — tap its header to collapse what you don't need, and the page will remember your choice on your next visit, on any device you sign in from.
Watch it on a chart
Read next
Reading the forecast
What the forecast dates mean, and why they can move by a day or two.
Reading the trading filter
The channel, its levels, the zero line — and what an event actually records.
Why a growth phase still has falling days
The single most common question about the forecast, answered with the weather.