
Growth start. Decline start. With the dates.
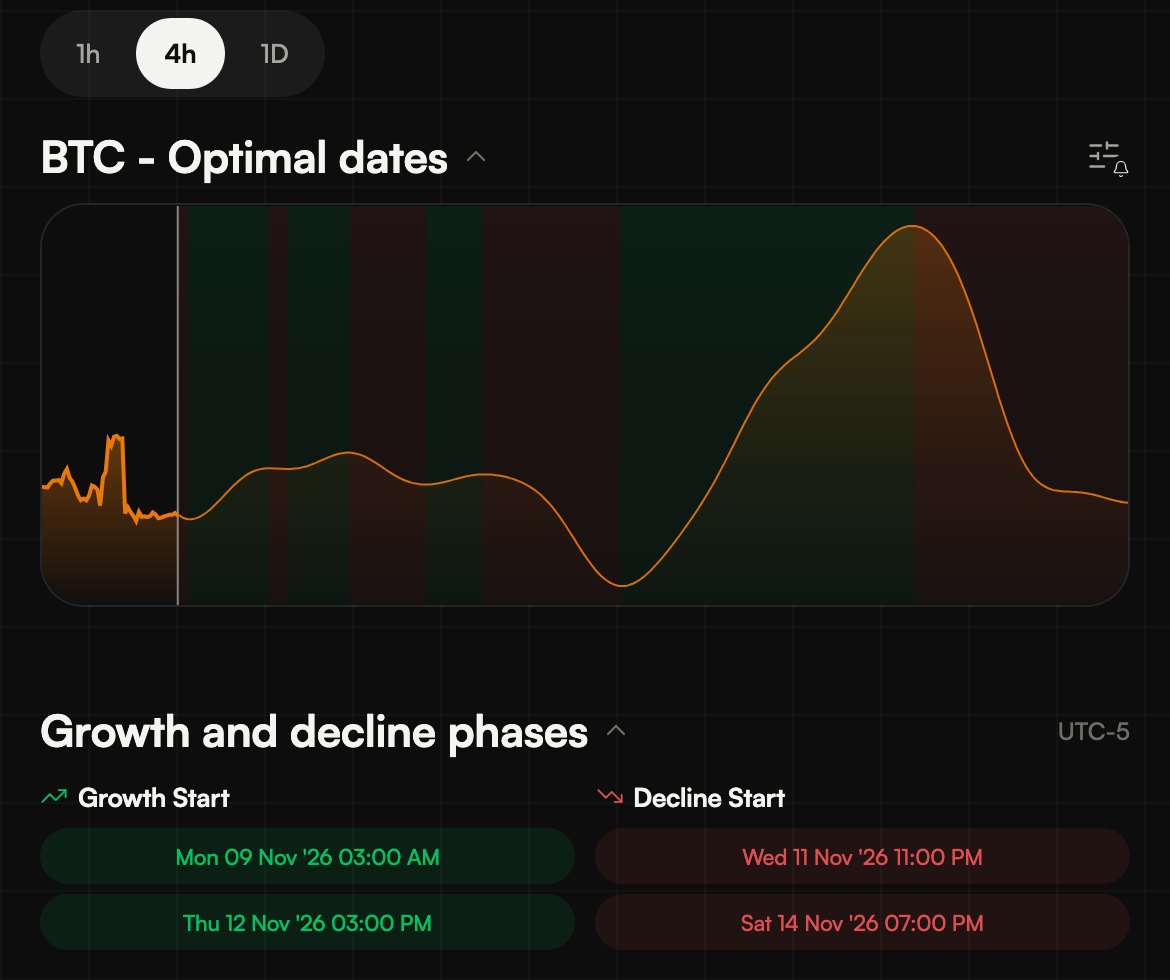
Every asset page in the ELCARO app shows the dates its next growth and decline phases are expected to start, on 1H, 4H or 1D, next to the Optimal dates chart of the cycle ahead.
Algorithmic, not AI. In the app on the web and in Telegram, within your plan. New accounts get 14 days of BTC free. The iOS and Android apps are in closed testing: join the early-access list on the home page.
01
Two columns of dates
Growth Start on the left, Decline Start on the right, in your own time zone.
- The Optimal dates chart above shows the shape of the cycle ahead.
- Switch between 1H, 4H and 1D at the top.
- A notification can tell you when a new phase starts.
02
A window, not a moment
The model recalculates as new data arrives. Peaks and troughs stay; the date attached to them can shift.
- By a day or two on higher timeframes, an hour or two on lower ones.
- Read from the top down: the higher frame says which phase you are in, the lower one when inside it.
- A growth phase can still have falling days.
Step by step in the guide
Questions.
Why did a date move? +
The model recalculates as new data arrives. Peaks and troughs stay where they are, but the exact date can shift by a day or two on higher timeframes, or an hour or two on lower ones.
Is the forecast made by AI? +
No. It is algorithmic. AI in ELCARO only explains readings in plain language.
Why does a growth phase have falling days? +
A phase describes the larger swing of its timeframe. Smaller swings inside it go both ways.
Is it free? +
Every new account gets 14 days of the Bitcoin forecast free, no card required. Plans add more assets and timeframes.
Related features
Educational tools, not financial advice. ELCARO never places orders for you.