
Fibonacci retracement, extension and channel
The three Fibonacci price-level tools: which points to click, which levels they draw and a typical use for each.
Free for every account. Every drawing tool works on any chart, on any asset and any timeframe, with no plan.
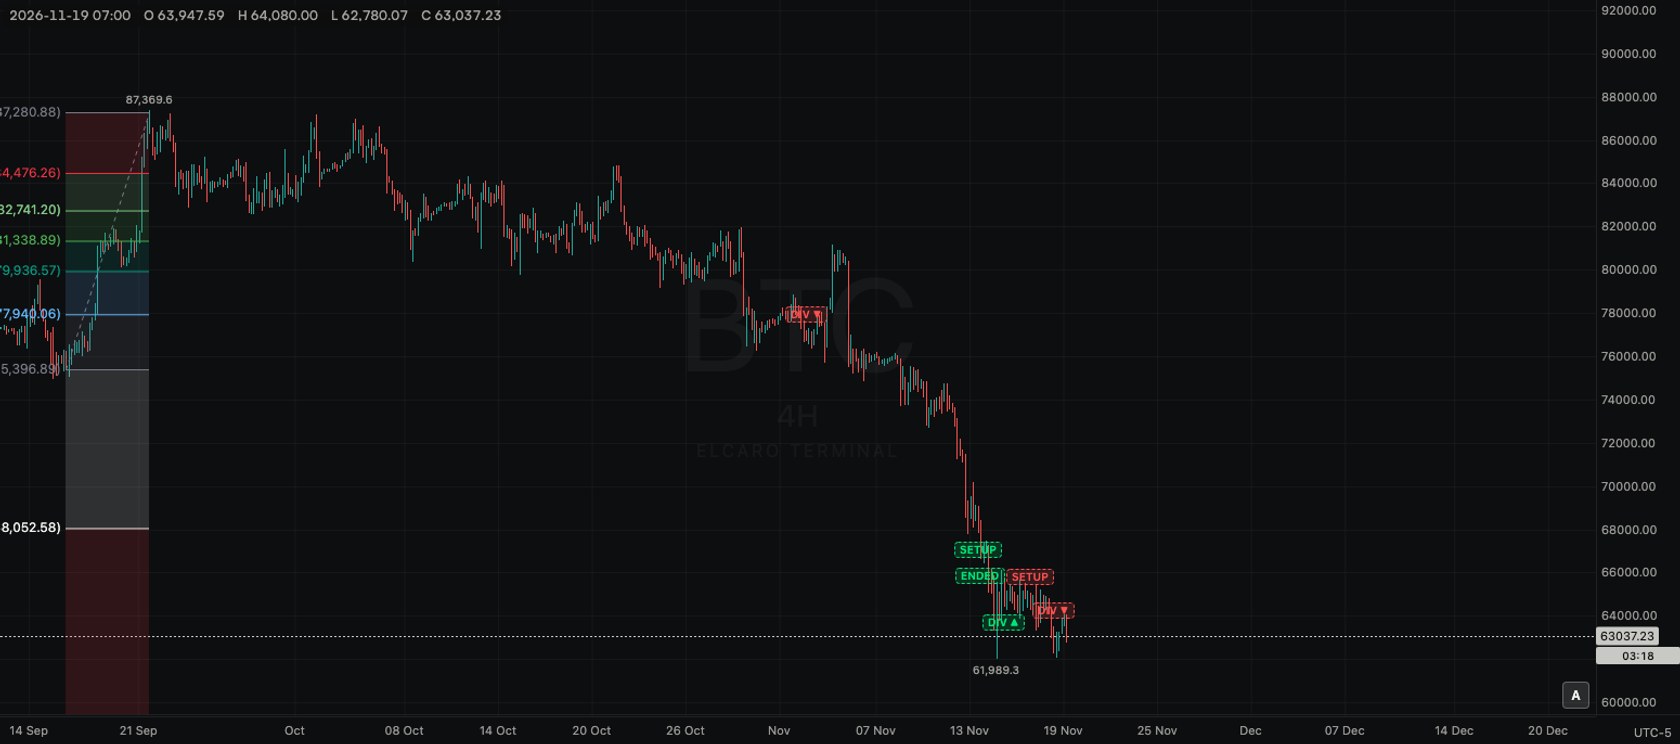
Open Gann and Fibonacci tools with the small arrow on its button. The first three tools draw horizontal or sloped price levels at Fibonacci ratios. Each level is labelled with its ratio and its price, and the bands between levels are shaded in colour.
The levels
All three tools use the same set: 0, 0.236, 0.382, 0.5, 0.618, 0.786, 1, 1.618, 2.618, 3.618 and 4.236. Each level has its own colour, so you can tell them apart at a glance.
Fib retracement
- What it is: levels between two prices. Level 1 sits at your first click, level 0 at your second, and the ratios fill the space between them and beyond.
- Points: two clicks. Hotkey
⌥F(Mac) orAlt+F(Windows). - Typical use: after a move from a low to a high, click the low and then the high to see where a pullback paused against these ratios.
How to draw it:
- 1. Press
⌥For pick Fib retracement in the group. - 2. Click where the move started.
- 3. Click where it ended. The levels appear with their prices on the left.
- 4. Drag either handle to adjust; the prices update.
Trend-based fib extension
- What it is: levels projected from a third point, measured by the size of the first move. Level 0 sits at the third point; level 1 is one full first move away from it.
- Points: three clicks: the start of a move, its end, and the end of the pullback that followed.
- Typical use: compare the size of a later move with the first one, for example to see whether it reached 1 or 1.618 times the first.
How to draw it:
- 1. Pick Trend-based fib extension.
- 2. Click the start of the first move.
- 3. Click its end.
- 4. Click the end of the pullback. The levels appear above or below it.
Fib channel
- What it is: lines parallel to a base line, spaced at Fibonacci ratios of a width you set, with shaded bands between them.
- Points: three clicks. The first two set the base line, the third sets the width that counts as level 1.
- Typical use: on a sloped move, draw the base along the lows and set the width at the first high to see sloped levels at the ratios.
Tips
- Turn on the Magnet so your clicks land on candle highs, lows, opens or closes.
- The direction you draw in matters. For a retracement on a fall, click the high first and the low second.
- A Fibonacci drawing is stored at its dates and prices, so it stays put when you change the timeframe.
- For the time-based Fibonacci tools, see Fibonacci time, fans and arcs.
Read next
Drawing tools
How the drawing toolbar works: picking a tool, placing points, selecting and styling a drawing, the magnet, drawing mode, locking, hiding and removing, undo, saving and the phone.
Fibonacci time, fans, arcs and pitchfan
Fib time zone, speed resistance fan, trend-based fib time, circles, spiral, speed resistance arcs, wedge and pitchfan: what each draws and how to place it.
Gann tools
Gann box, Gann square fixed, Gann square and Gann fan: what each draws, how many clicks it takes and a typical use.