
Gann tools
Gann box, Gann square fixed, Gann square and Gann fan: what each draws, how many clicks it takes and a typical use.
Free for every account. Every drawing tool works on any chart, on any asset and any timeframe, with no plan.
The four Gann tools are at the bottom of Gann and Fibonacci tools. Open the group with the small arrow on its button. Each one takes two clicks and splits the space between them into price and time fractions.
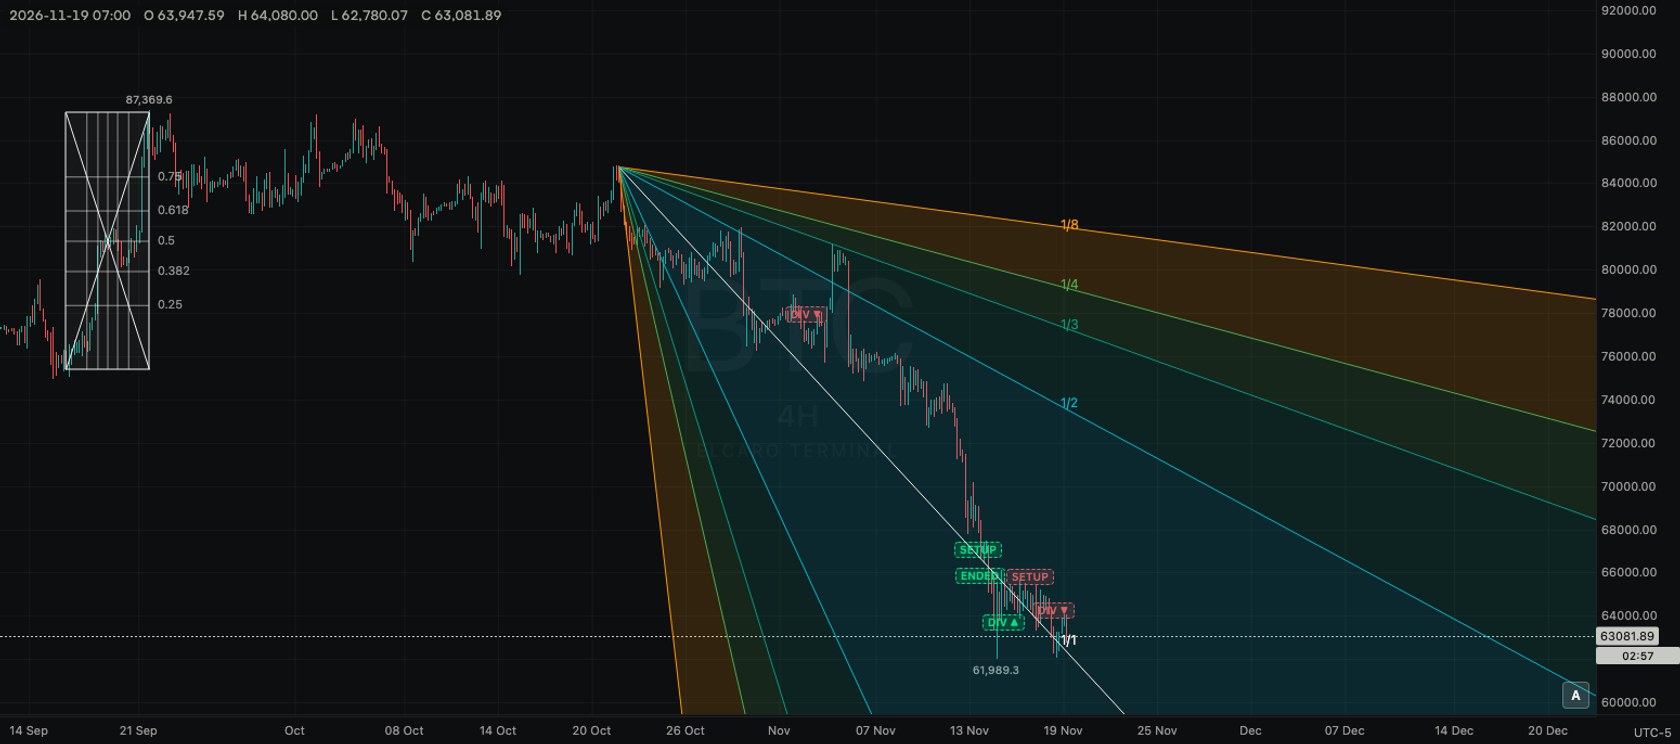
Gann box
- What it is: a box between two corners, divided by horizontal and vertical lines at 0.25, 0.382, 0.5, 0.618 and 0.75, plus both diagonals.
- Points: two clicks, on opposite corners.
- Typical use: frame a move from its low to its high and see which fractions of its height and its length later bars return to.
How to draw it:
- 1. Pick Gann box.
- 2. Click one corner, for example the low where the move started.
- 3. Click the opposite corner, for example the high where it ended. The grid fills in.
Gann square fixed
- What it is: a square grid. Dragging to the side sets the size of the square; up or down only sets which way it opens. Inside are level lines at 0.25, 0.382, 0.5, 0.618 and 0.75, a fan of lines from the starting corner and quarter arcs.
- Points: two clicks: the starting corner, then the size.
- Typical use: keep the same square proportions on screen while you compare several moves.
Gann square
- What it is: the same grid with its fan and arcs, but the box follows both points freely, so it can be wider or taller than it is square.
- Points: two clicks, on opposite corners.
- Typical use: fit the grid exactly to one move's height and duration.
Gann fan
- What it is: nine lines from one point. The middle line, 1/1, runs through your second point. The others are steeper or flatter: 1/8, 1/4, 1/3 and 1/2 on one side, 2/1, 3/1, 4/1 and 8/1 on the other. Each is labelled and the areas between them are shaded.
- Points: two clicks: the origin, then a point that sets the 1/1 line.
- Typical use: start it at a major low, set the 1/1 line along the first part of the rise, and see which line later prices follow.
How to draw it:
- 1. Pick Gann fan.
- 2. Click the origin, such as a clear low or high.
- 3. Click a second point to set the 1/1 line. The other lines spread out from the origin.
Things to know
- The fan lines and squares depend on how the chart is scaled on screen. Zooming or changing the price scale changes their angles, and the same drawing can look different on another timeframe.
- Change the colour, width or line style in the style bar.
- Use the Magnet to start exactly on a candle's high or low.
- A Gann drawing is saved with your other drawings on that asset and chart.
Read next
Fibonacci time, fans, arcs and pitchfan
Fib time zone, speed resistance fan, trend-based fib time, circles, spiral, speed resistance arcs, wedge and pitchfan: what each draws and how to place it.
Fibonacci retracement, extension and channel
The three Fibonacci price-level tools: which points to click, which levels they draw and a typical use for each.
Drawing tools
How the drawing toolbar works: picking a tool, placing points, selecting and styling a drawing, the magnet, drawing mode, locking, hiding and removing, undo, saving and the phone.