
Measuring tools and Anchored VWAP
Price range, date range, date and price range, the Measure button, and Anchored VWAP: what each shows and how to place it.
Free for every account. Every drawing tool works on any chart, on any asset and any timeframe, with no plan.
The measuring tools are in Forecasting and measurement tools, with Anchored VWAP just above them. The Measure button under the groups gives you the fullest one in a single click.
Price range
- What it is: the distance between two prices. The label shows the difference, the change in percent and the number of ticks.
- Points: two clicks.
- Typical use: see how far price moved from a low to a high.
Date range
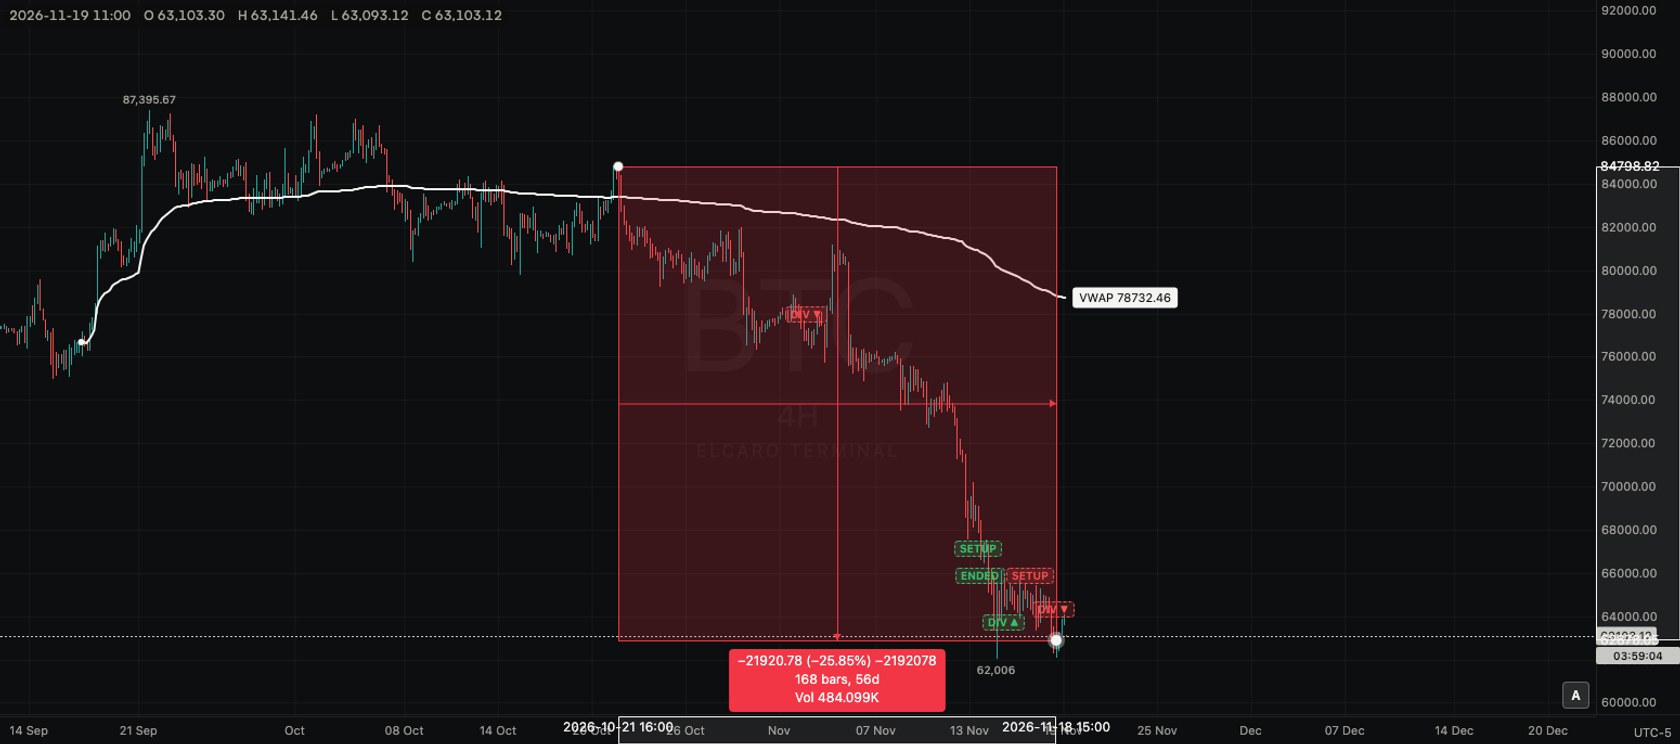
- What it is: the distance between two moments. The label shows the number of bars, the time span and the total volume of those bars.
- Points: two clicks.
- Typical use: see how many bars and how much time a move took.
Date and price range
- What it is: both at once: price difference, percent, ticks, bars, time and volume.
- Points: two clicks.
- Typical use: a quick check of a move's size, length and volume together.
This one is a quick measuring aid, not a lasting drawing. It disappears with your next click on the chart.
The Measure button
- 1. Click Measure under the groups. It picks Date and price range.
- 2. Click where the move starts.
- 3. Click where it ends. The box shows the numbers.
- 4. Click anywhere on the chart to clear it.
With Stay in drawing mode on, the next click starts a new measurement right away, so you can measure several moves in a row.
Measuring with a line
The Info line in the Trend line tools group shows similar numbers plus an angle, and it stays on the chart. Use it when you want to keep a measurement. See Lines and line alerts.
Anchored VWAP
- What it is: the volume-weighted average price from a bar you choose up to the last bar. Each bar's typical price counts in proportion to its volume, and the line updates as new bars arrive.
- Points: one click, on the bar to start from.
- Typical use: start it at a major low, high or news day and see where price sits against the average paid since then.
How to place it:
- 1. Open Forecasting and measurement tools with the small arrow.
- 2. Pick Anchored VWAP.
- 3. Click the bar to start from. The line runs from there to the newest bar.
- 4. To move the start, select the line and drag its point to another bar.
Tips
- Turn on the Magnet to measure from an exact high, low, open or close.
- Measurements work in the empty area right of the last candle too; the bar count and time continue there.
Escclears a measurement or cancels one halfway.
Read next
Drawing tools
How the drawing toolbar works: picking a tool, placing points, selecting and styling a drawing, the magnet, drawing mode, locking, hiding and removing, undo, saving and the phone.
Lines and line alerts
Trend line, ray, info line, extended line, trend angle, horizontal and vertical lines, cross line, and how to set an alert from a line you drew.
Cycles and projections
Cyclic lines, time cycles and sine line, plus your own sketches of a possible path: Forecast, Bars pattern, Ghost feed and Projection.