
Cycles and projections
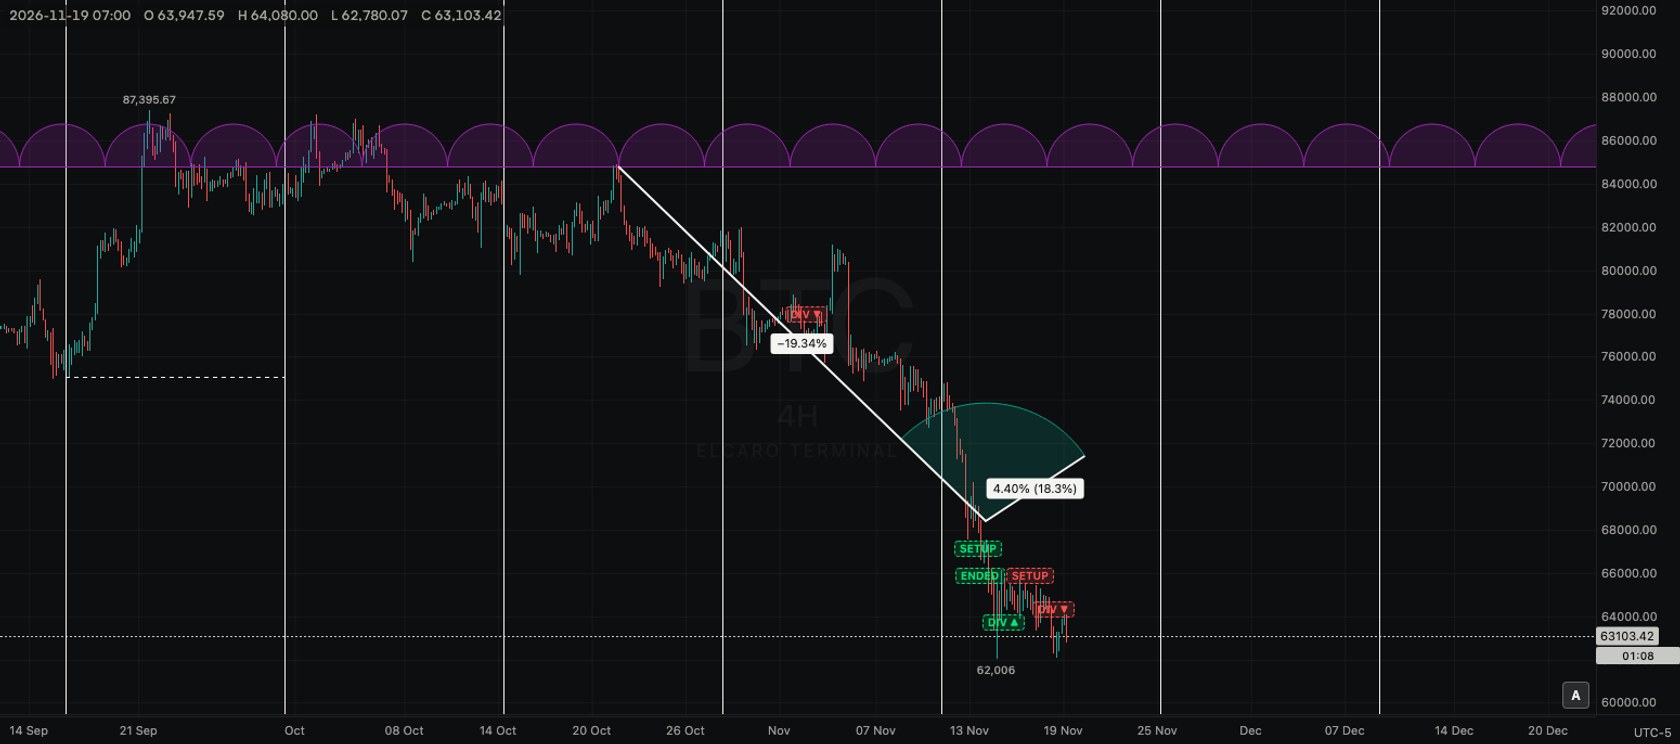
Cyclic lines, time cycles and sine line, plus your own sketches of a possible path: Forecast, Bars pattern, Ghost feed and Projection.
Free for every account. Every drawing tool works on any chart, on any asset and any timeframe, with no plan.
Cycles are at the bottom of the Patterns group. The sketching tools are in Forecasting and measurement tools. All of them can reach into the empty area right of the last candle.
Cycles
Cyclic lines
- What it is: vertical lines repeated at an equal spacing across the chart.
- Points: two clicks. The distance between them sets the spacing.
- Typical use: set the spacing to the gap between two lows and see whether later lows land near the lines.
Time cycles
- What it is: a row of half circles of equal width, repeated in both directions along a horizontal line.
- Points: two clicks. The distance between them is the width of one cycle.
- Typical use: show a repeating rhythm of swings at a glance.
Sine line
- What it is: a wave across the whole chart. Your first click is a crest or a trough, your second is the next opposite extreme, half a period later.
- Points: two clicks.
- Typical use: lay a regular wave over a chart that swings back and forth.
Your own sketches
These tools draw what you think might happen. They are your notes on the chart, nothing more.
Forecast
- What it is: an arrow from a start point to an end point you choose, with a box that shows the price change, the change in percent, the number of bars and the time.
- Points: two clicks: where the path starts and where you think it could end.
- Typical use: note an idea of a path and come back later to compare it with real bars.
- Not the ELCARO forecast: this drawing is only your own sketch. It has nothing to do with the ELCARO Forecast indicator and does not use its data.
Bars pattern
- What it is: a copy of a stretch of real bars, pasted as faint candles at another place on the chart.
- Points: three clicks. The first two mark the stretch to copy, the third sets where the copy starts; its first open lands at that price.
- Typical use: see how a past stretch of bars would look if it repeated from today.
Ghost feed
- What it is: a path of faint, made-up candles along the points you click.
- Points: up to ten clicks. Double-click (double-tap on a phone) to finish earlier.
- Typical use: sketch a rough route for the next bars, with candles instead of a plain line.
Projection
- What it is: two legs from three points. It shows the change in percent of each leg, the size of the second leg against the first, and a shaded sector between them.
- Points: three clicks: the start, the turn and the end of the second leg.
- Typical use: compare a pullback with the move before it.
How to sketch a path
- 1. Open Forecasting and measurement tools with the small arrow.
- 2. Pick Forecast, Ghost feed or Projection.
- 3. Click on the last candles, then in the empty area to the right.
- 4. Select the sketch later to change its colour, lock it or delete it.
Read next
Chart patterns and Elliott waves
XABCD, Cypher, head and shoulders, ABCD, triangle and three drives patterns, and the five Elliott wave tools: how many points each takes and what it labels.
Measuring tools and Anchored VWAP
Price range, date range, date and price range, the Measure button, and Anchored VWAP: what each shows and how to place it.
Drawing tools
How the drawing toolbar works: picking a tool, placing points, selecting and styling a drawing, the magnet, drawing mode, locking, hiding and removing, undo, saving and the phone.
ELCARO Forecast in the Terminal
How to switch the forecast on, read its solid and dashed parts, peaks and troughs, show turn dates, and set an alert before the next turn.