
The bigger picture, without switching charts.
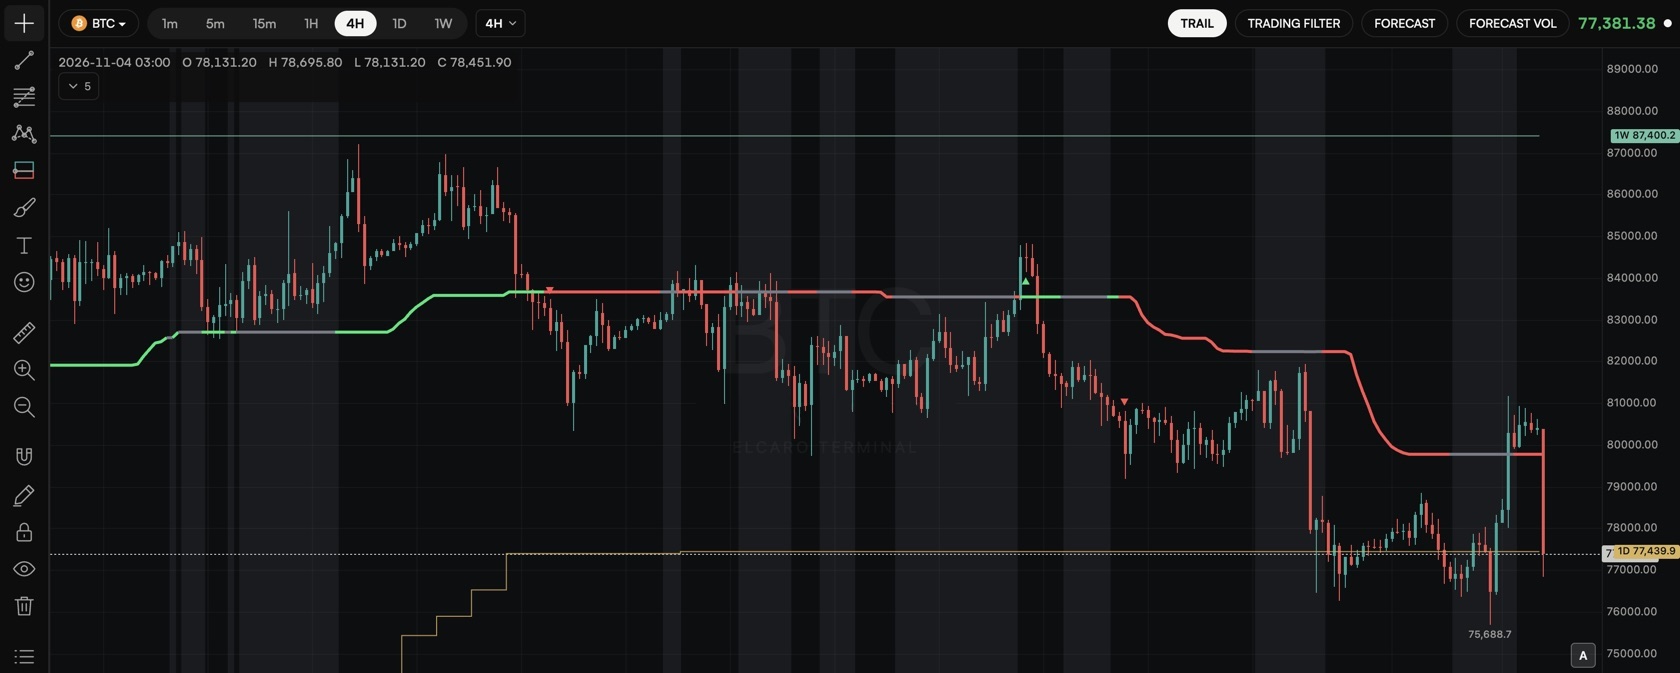
Higher-timeframe trail levels draw the TRAIL of bigger timeframes on the chart you are looking at: step lines with a price tag for 1H, 4H, 1D and 1W.
In the ELCARO Terminal. Each level shows if its own timeframe is in your plan.
01
Step lines with a price tag
Open the TRAIL settings, turn on Show on the price chart and pick the levels.
- 4H, 1D and 1W are on by default.
- The colour stands for the timeframe, not the direction.
- Only timeframes above the chart's own are drawn: on a 4H chart, 1D and 1W.
02
Read from the top down
The higher timeframe tells you which phase you are in; the lower one refines when inside it.
- See where the daily or weekly trail sits while you work on 15 minutes or 1 hour.
- Combine it with the forecast dates of the same timeframes.
Step by step in the guide
Questions.
Why can I not see the 1H level on a 4H chart? +
Only timeframes above the chart's own are drawn. On a 4H chart you see the 1D and 1W levels.
What do the colours mean? +
Each colour stands for a timeframe, not for growth or decline.
Which plan do I need? +
Each level shows if its own timeframe is in your plan. The Terminal plan opens all of them.
Related features
TRAIL A stepped level that follows the trend and marks the bar where it flips. Timeframe alignment A message when the timeframes you pick for an asset point to the same phase. Forecast with turn dates When the next growth or decline phase is expected to start, drawn ahead of the last candle.
Educational tools, not financial advice. ELCARO never places orders for you.