
The phase you are in, and where it would break.
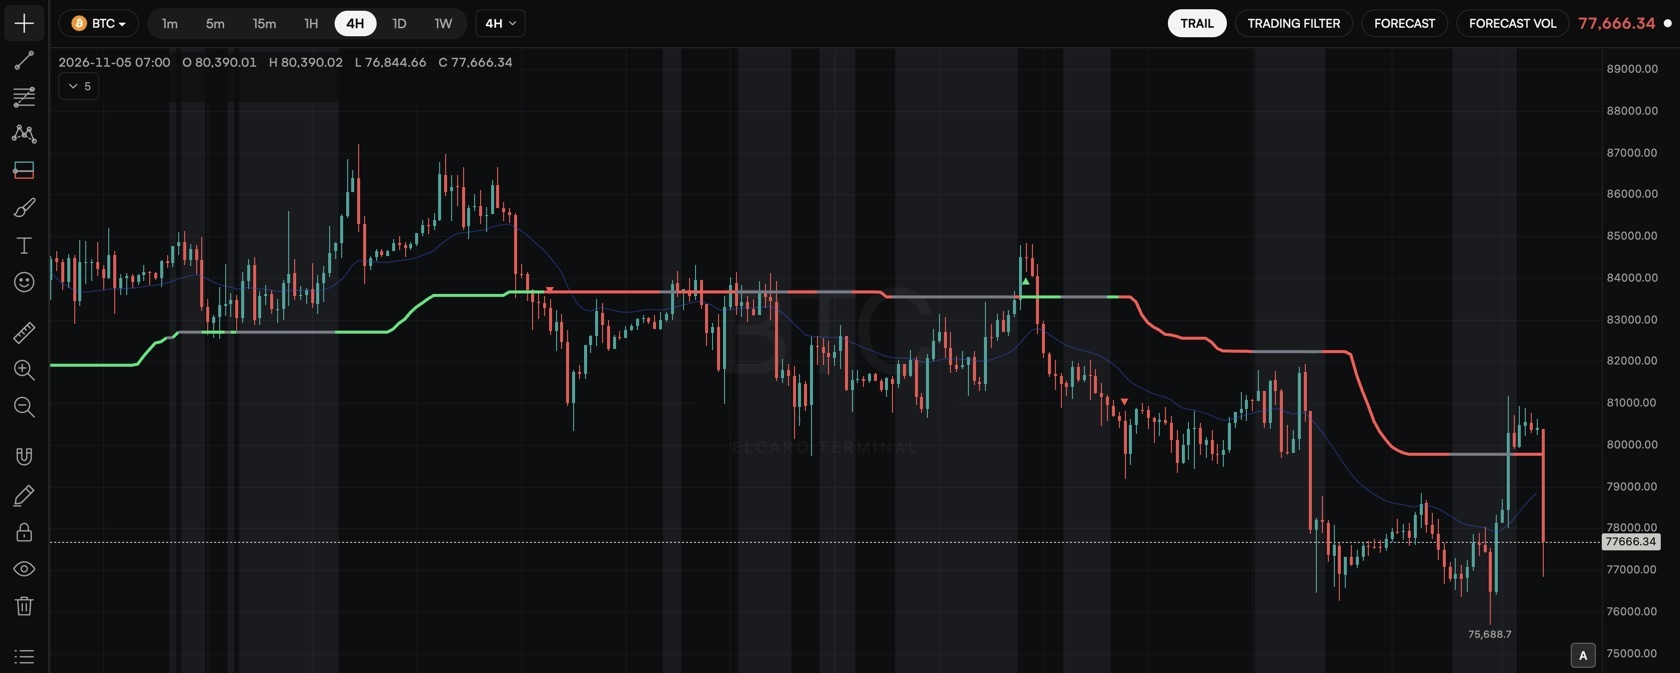
TRAIL is a stepped level that follows the trend on the price chart. It sits on the growth side or the decline side, marks the bar where it flips, and turns grey while the trend is undecided.
Algorithmic. In the ELCARO Terminal, within your plan.
01
One line, three states
The trail takes the growth colour or the decline colour, and grey while the picture is unclear.
- Flip: TRAIL moves to the other side. This is the moment the trend changes by TRAIL.
- Cross: a bar closes on the other side of the line.
- Grey zone: TRAIL keeps its previous side until the picture clears.
02
Settings that stay out of the way
Markers where the trail turns, an optional grey background and a thin inner line.
- The inner line is a smoothed average of recent closes that adapts to how strongly the market trends.
- Adaptive colour follows the direction.
- Higher-timeframe trail levels can sit on the same chart.
03
A message when it flips
Create a TRAIL alert and ELCARO checks it when each bar closes, even with the Terminal closed.
- TRAIL flips phase: to growth, to decline, or either.
- Price crosses TRAIL: up, down, or either way.
- Delivered to Telegram and as a notice in the app.
Step by step in the guide
Questions.
What does a TRAIL flip mean? +
TRAIL has moved to the other side: from growth to decline or back. It describes a change in the trend by TRAIL. It is not an instruction to act.
What is the grey zone? +
A stretch where the trend is undecided. TRAIL keeps its previous side until the picture clears.
Can I see TRAIL of higher timeframes? +
Yes. Turn on Higher timeframe levels in the TRAIL settings to draw the 1H, 4H, 1D and 1W levels on a lower-timeframe chart.
Which plan do I need? +
An app plan opens it on the assets and timeframes of that plan; the Terminal plan opens it on every asset and timeframe.
Related features
Educational tools, not financial advice. ELCARO never places orders for you.